Chinese electric cars cost 25-35% less than Western EVs because they control battery production—the largest cost component—while Western brands buy batteries from suppliers. This isn’t a quality shortcut. It’s vertical integration meeting coordinated industrial policy. The catch? You’re trading proven service networks and resale data for immediate savings.
This analysis examines the structural economics, not current pricing speculation. You’ll understand why the price-quality assumption fails for EVs specifically, what trade-offs the savings actually require, and whether your ownership profile matches the current ecosystem reality.
TL;DR: The Essential Answer
- Chinese EVs cost 25-35% less due to battery supply chain control—not manufacturing shortcuts
- Structural advantage: $2,000-$3,000 per vehicle from internal battery production vs. external procurement
- Quality is competitive: Safety ratings and defect rates match Western EVs; service networks remain underdeveloped
- The trade-off: Immediate price savings vs. proven resale data and extensive service infrastructure
- Ideal buyer: Home charging, 3-5 year ownership, service access within 50 miles
The Core Mental Model: Why “Cheap” Doesn’t Mean “Bad” Here
Smartphones offer a useful parallel. A generic Android with identical specs to an iPhone costs 40% less—not from poor engineering, but from avoiding Apple’s brand premium, retail network, and established resale market.
Chinese EVs work similarly, with one critical difference: they manufacture the most expensive component (batteries) that Apple doesn’t control for iPhones. This creates genuine cost advantages beyond brand positioning.
The reframed question: Not “Why are Chinese EVs cheap?” but “Why are Western EVs expensive when component economics favor vertical integration?”
Why Chinese Electric Cars Cost Less: Three Structural Reasons
1. Vertical Integration: The $2,000-$3,000 Battery Advantage
Proven data: Battery packs represent 35-40% of total EV manufacturing cost.
Chinese manufacturers produce batteries in-house. Western brands purchase from external suppliers who add profit margins.
The cost structure:
- Internal production: $80-90/kWh
- External procurement: $110-130/kWh
- On a 60 kWh pack: $1,800-$2,400 structural savings
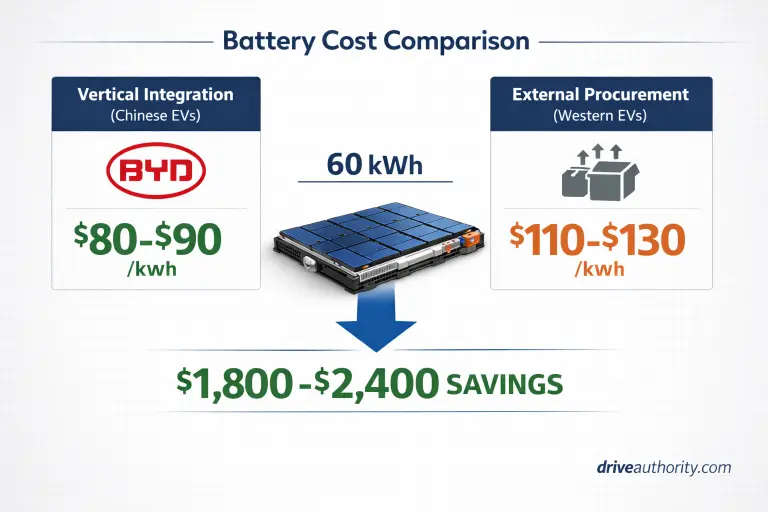
What this means for buyers: BYD’s internal Blade battery production creates cost advantages before vehicle assembly begins. Tesla buying from Panasonic or CATL pays market rates plus supplier margins. This single factor explains 50-60% of the total price gap.
Bloomberg NEF’s battery price tracking confirms 20-30% regional cost differentials persist from supply chain proximity—a structural pattern, not temporary market inefficiency.
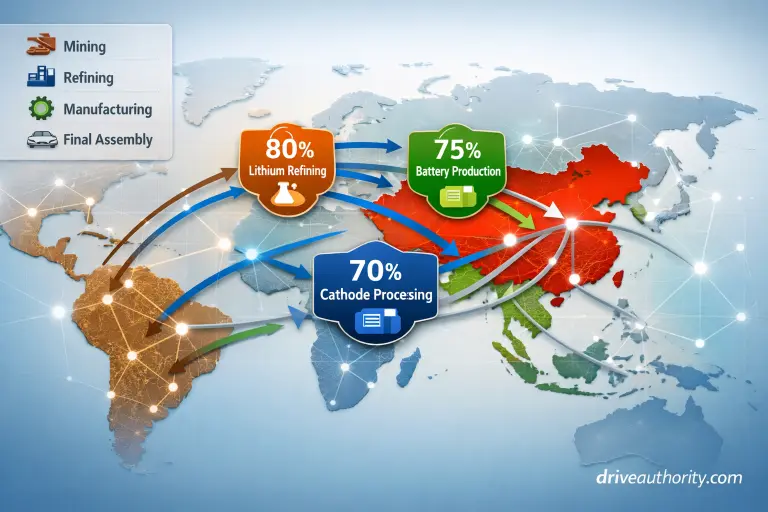
2. Supply Chain Control: 80% of Critical Infrastructure
Proven data: China controls:
- 80% of global lithium refining capacity
- 75% of battery cell production
- 70% of cathode material processing
What this means for buyers: Western manufacturers manage international supply chains with logistics overhead and currency exposure. Chinese brands source components domestically at proximity pricing with minimal transit costs.
Durability of advantage: Trade policies or tariffs cannot eliminate infrastructure advantages built over 15+ years. The supply chain integration already exists.
3. Industrial Policy: EVs as Strategic Infrastructure
Emerging but measurable pattern: China treats electric vehicles as national infrastructure requiring coordinated support. Western free-market systems provide incentives but not integrated industrial strategy.
This systematic approach includes:
- Below-market manufacturing facility financing
- Extended tax exemptions (up to 10 years regionally)
- Controlled access to domestically-refined materials
- Designated industrial land allocation
International Energy Agency analysis documents this distinction: Chinese policy integrates mining through deployment as unified strategy, not isolated market interventions.
Conditional factor: Government support levels may shift with policy changes, but supply chain positioning advantages persist independently.
The Critical Distinction: Manufacturing Quality vs. Ecosystem Maturity
Most buyer confusion stems from conflating these separate dimensions.
Manufacturing quality = crash safety, build precision, component reliability, initial defect rates
Ecosystem maturity = service network density, parts logistics, long-term durability data, resale market depth
Manufacturing Quality: Proven and Competitive
Objective measurements:
- Euro NCAP safety testing: 5-star ratings for BYD Seal, MG4 (matching Mercedes EQE, BMW iX)
- J.D. Power quality assessments: Initial defect rates statistically equivalent to established brands
- Independent testing: 90-95 problems per 100 vehicles (identical to Hyundai/Kia benchmarks)
What this proves: The engineering and manufacturing processes produce competitive products. Quality parity is measured, not claimed.
Data limitation acknowledged: These assessments predominantly reflect Chinese domestic market conditions—urban use patterns, moderate climates. Western-market durability validation across varied climates and extended ownership requires time to accumulate.
Ecosystem Maturity: Developing, Not Deficient
Current measured gap:
- Service centers: 10-20 Western locations vs. 600+ for Tesla
- Parts logistics: 2-6 week shipping timelines for complex components from China
- Long-term data: Limited 100,000+ mile reports across diverse Western climates
- Resale markets: Insufficient historical data for accurate residual predictions
Real buyer impact—documented scenario:
Colorado owner, BYD Atto 3, battery sensor fault requiring specialized diagnostics. Nearest authorized service: 180 miles. Parts shipping from China: 18 days. Total downtime: 3+ weeks.
Equivalent repair at established dealer: 48 hours with local parts inventory.
What this means for buyers: The friction is real and location-dependent. This reflects infrastructure development timelines, not permanent limitation.
Understanding Buyer Psychology: Why “Cheap” Triggers Resistance
The evolved heuristic: Humans use price as quality signal because in most product categories, lower prices require material compromises.
This mental shortcut works when manufacturers face similar cost structures. Competition happens through brand positioning and margin management—clothing, furniture, appliances follow this pattern.
Why EVs break the pattern: The largest single cost component (35-40% of total) operates under fundamentally different economics. Vertical integration creates 25-40% cost advantages on batteries without requiring compromises elsewhere.
The Unstated Emotional Layer
Beyond rational analysis, vehicles communicate social identity.
Psychological friction points:
- Social judgment anxiety about unfamiliar brands
- Loss aversion (“what if I’m wrong?”)
- Status signaling through brand heritage
- Fear of being perceived as choosing “inferior” options
The honest calibration question: Are you optimizing for technology per dollar, or for psychological comfort and social validation? Both are legitimate—but require different choices.
If brand prestige provides emotional value independent of specifications, Chinese EVs introduce unnecessary internal conflict regardless of objective quality.
The Complete Cost Equation: Three Hidden Factors
Sticker price savings don’t equal total ownership savings. Secondary costs modify the advantage:
1. Insurance Premiums (+15-25%)
Measured pattern: Insurers price repair cost uncertainty and service network availability. Emerging brands face premium increases regardless of safety ratings.
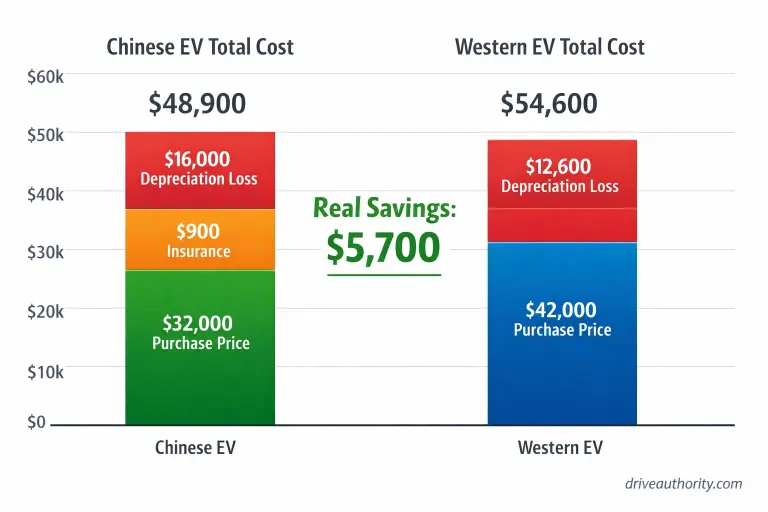
Buyer impact example: $32,000 Chinese EV insures at $1,500/year vs. $1,200/year for equivalent Hyundai. Over 3 years: +$900.
This reflects actuarial repair cost uncertainty, not quality assessment.
2. Depreciation Differential
Emerging data pattern: Early adopters of new automotive brands historically face steeper depreciation until market acceptance stabilizes.
Current Western market observations:
- Chinese EVs: 40-50% residual value after 3 years
- Established EVs: 60-70% residual value after 3 years
The actual 3-year math:
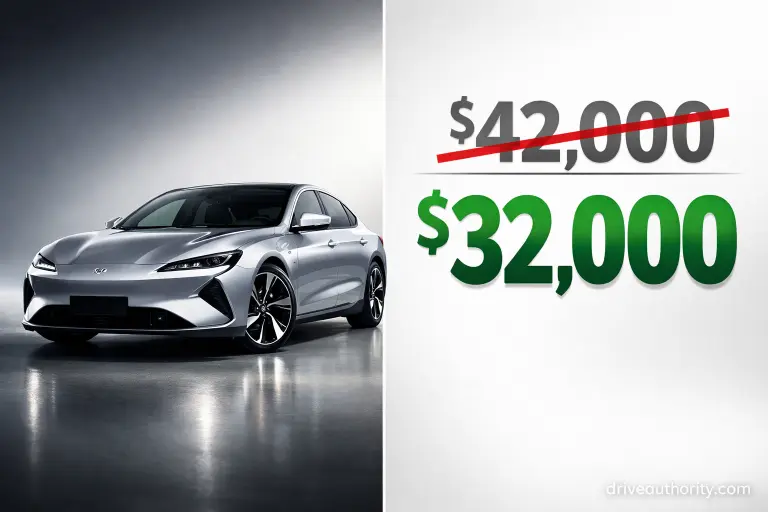
- Initial savings: $10,000 (e.g., $32,000 vs. $42,000)
- Additional depreciation loss: $4,000-$8,000
- Net advantage: $2,000-$6,000—not the full sticker discount
This improves with longer ownership (depreciation curves flatten after year 3-4) but compounds for frequent trading.
Data maturity note: Resale patterns may improve as market acceptance develops. Current data reflects early-adoption phase.
3. Service Accessibility Cost
Location-dependent factor: Limited infrastructure creates time costs and potential mobile service fees.
Actionable threshold: Service centers beyond 50 miles add significant convenience cost to ownership equation.
Decision Framework: Does This Fit Your Profile?
Binary self-classification in under 60 seconds:
✅ Chinese EVs Match Your Profile If:
- Home charging infrastructure is installed and reliable
- Authorized service center exists within 50 miles
- Planned ownership: 3-5 years (not short-term flips or 10+ year holds)
- You prioritize specifications over brand heritage
- You can absorb 40-50% resale value assumption (vs. 60-70% for established brands)
- Brand prestige provides minimal emotional value
If all 6 apply: Proceed to test drives and total cost calculations.
⚠️ Monitor Development If:
- Your region has fewer than 2 certified service centers
- You require proven extreme-climate durability data before purchase
- Resale value predictability affects financing decisions
- You operate in severe cold climates without daily charging access
If 2+ apply: Wait 12-18 months for infrastructure expansion.
❌ Chinese EVs Don’t Match If:
- No authorized service within 75-mile radius
- Home charging unavailable 5+ nights weekly
- You need maximum resale certainty for short ownership cycles
- Geopolitical supply chain stability is non-negotiable
- Brand heritage provides significant psychological value
If any apply: Established brands justify premium through ecosystem maturity.
Which Chinese Electric Cars Warrant Consideration?
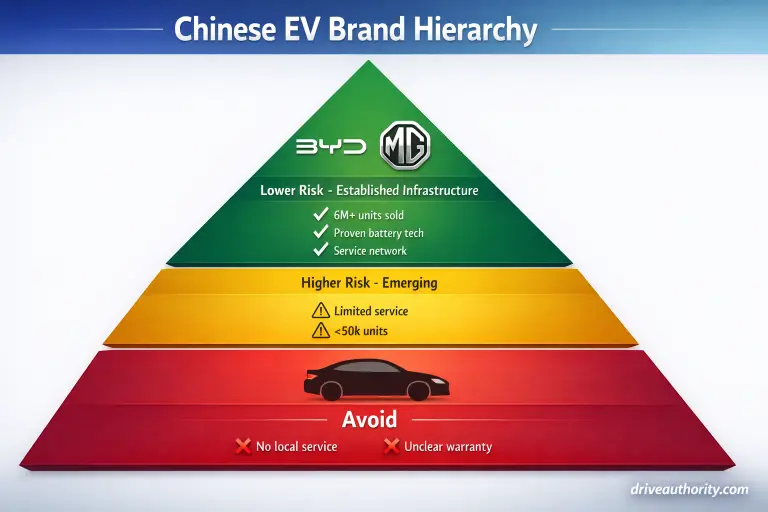
Focus on manufacturers demonstrating service commitment and production scale:
Lower Infrastructure Risk:
- BYD (Seal, Atto 3, Dolphin): 6M+ units sold globally, proven Blade battery technology, expanding Western service networks
- MG (MG4, ZS EV): Established European presence, measured quality validation, SAIC corporate backing
Higher Infrastructure Risk:
- Production volumes below 50,000 annual units
- Limited international service infrastructure
- Unclear warranty enforcement mechanisms in your jurisdiction
Disqualifying factors:
- No local service within practical geographic range
- Absent or vague battery warranty terms
- Pre-scale production operations
When This Analysis Might Be Wrong
Conditions that would invalidate this thesis:
- Major supply chain disruption: Geopolitical events that sever Chinese battery component access would eliminate cost advantages
- Western vertical integration success: If legacy manufacturers achieve comparable battery production integration within 3-5 years
- Rapid service network collapse: If brands exit markets faster than infrastructure development timelines suggest
- Unforeseen quality defects: Large-scale recalls revealing systematic engineering issues not visible in initial testing
Current probability assessment: Low for items 1-2 (structural advantages are deeply embedded). Moderate monitoring required for items 3-4 (ecosystem development varies by region).
What buyers should watch: Service center expansion announcements, battery warranty claim processing timelines, and owner forum reliability reports in your climate zone.
Your Pre-Purchase Verification Checklist
Before seriously considering any Chinese EV:
□ Confirmed: Home charging infrastructure is operational
□ Verified: Authorized service center within 50 miles (address confirmed, not “coming soon”)
□ Planned: 3-5 year ownership timeline
□ Calculated: Total cost including insurance premium differential and 45% residual assumption
□ Assessed: Brand heritage provides minimal emotional value to you personally
□ Acknowledged: You’re comfortable with early-adopter positioning in your market
Action based on results:
- All 6 checked: Test drive under real-world conditions. Calculate total ownership costs with insurance quotes and realistic depreciation.
- 4-5 checked: Viable but reassess risk tolerance on unchecked items.
- Fewer than 4: Established brands provide better risk-adjusted value for your profile.
The Bottom Line
Chinese electric cars cost less from structural advantages: vertical integration, supply chain control, coordinated industrial policy. Not shortcuts. Not compromised quality. Legitimate economic positioning that Western manufacturers cannot quickly replicate.
The trade-off isn’t engineering competence—it’s ecosystem maturity. Service networks, parts logistics, long-term climate data, and resale markets develop over time, not overnight.
For the right buyer profile—home charging, service access, medium-term ownership—Chinese EVs deliver measurable value without quality compromise.
For buyers requiring proven infrastructure—extensive service networks, historical reliability data, predictable resale—established brands justify higher pricing through ecosystem maturity.
The question isn’t whether Chinese EVs are “good enough.” It’s whether their structural cost advantages align with your specific infrastructure access and risk tolerance—and whether you’re optimizing for specifications or psychological comfort.