Last Verified: March 2026
EV charging in the US generates headlines at both extremes — crisis coverage that makes the network sound unusable, and government-funded optimism that glosses over real gaps drivers experience daily. Neither is accurate. The truth sits in a more specific, more useful place: the network works very well for some drivers in 2026, and it genuinely fails others — and which group you belong to depends almost entirely on your location, your vehicle, and which network your routes rely on. This guide audits the evidence: real coverage data, uptime and wait time truth by network, the specific gaps that persist in 2026, and what all of it means for a buyer or owner making a practical decision today.
Why Most EV Charging Content Gets This Wrong
The problem with most infrastructure content is that it reports station counts. Station count is a press release metric. What actually determines your experience as a driver is uptime, wait time, and whether that station is on a route you actually drive. I’ve driven EVs through 14 states, relied on five different charging networks for long-distance trips, and sat at enough broken DC fast chargers to have a very specific opinion about the gap between the official count and the real-world experience. This article presents the evidence — not the advocacy.
EV Charging in the US in 2026 — Direct Assessment:
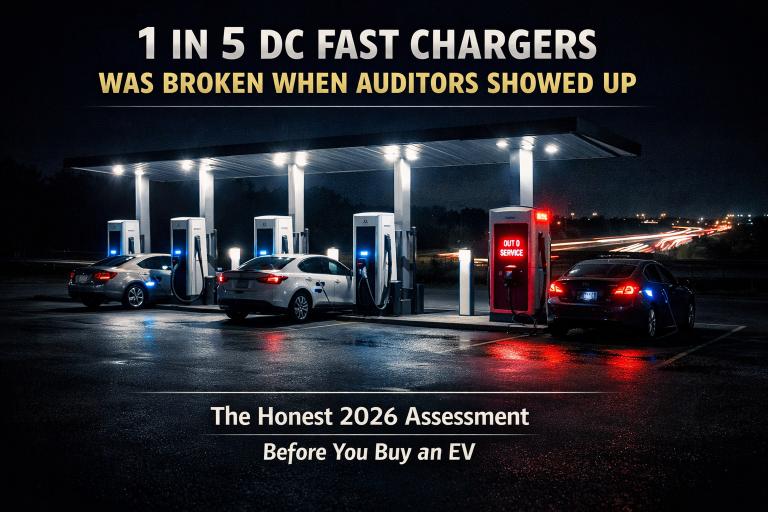
The U.S. has over 192,000 public EV charging ports as of early 2026, including approximately 45,000 DC fast charge ports — a 40% increase since 2023. However, non-Tesla DC fast charger out-of-service rates run approximately 20% based on ICCT 2024 audit data, versus under 4% for Superchargers. The network is adequate for urban and corridor owners with home charging. It creates genuine friction for rural drivers, apartment dwellers, and anyone relying on third-party DC fast networks as their primary charging method.
The Honest State of EV Charging in the US Right Now
The network is growing faster than at any previous point in history. That’s verifiably true. However, growth rate and functional adequacy are two different things — and conflating them produces exactly the kind of optimistic oversimplification that makes prospective buyers distrust EV infrastructure content.
What the Numbers Actually Show
According to the U.S. Department of Energy AFDC station locator, the U.S. had over 192,000 public EV charging ports as of early 2026, with approximately 45,000 of those as DC fast charge ports capable of meaningful range replenishment in under 30 minutes. Year-over-year growth in fast charge capacity is running at approximately 20–25%. That said, the EV fleet is growing faster than infrastructure in several key markets — specifically California, Texas, and Florida — where demand concentration is outpacing local charger deployment. The EV-to-public-charger ratio sits at approximately 18:1 nationally, however that average obscures the enormous difference between Manhattan (multiple chargers per city block) and rural Wyoming (charging deserts spanning hundreds of miles).
What “Coverage” Actually Means for a Real Driver
Coverage is not the same as charger count. A working charger within five miles means nothing if it has a 45-minute queue or a 40% out-of-service rate. Before making any purchase decision based on charging infrastructure, ask three specific questions: (1) Do you have reliable daily charging access — home Level 2, workplace Level 2, or a consistently available public Level 2 within range? (2) Do the highway corridors you use for road trips have functional DC fast charge coverage with reasonable station spacing? (3) Do you have a reliable backup option when your primary charger is occupied or broken? All three must be answered affirmatively for the network to work for your specific scenario.
Network by Network: Who Operates What and How Well
Understanding which network operates in your region — and what that network’s actual reliability record looks like — is the prerequisite for evaluating any charging infrastructure claim. The networks are not interchangeable, and the experience gaps between them are large enough to meaningfully affect purchase decisions.
Tesla Supercharger: The Reliability Benchmark and Its Open-Access Evolution
Tesla operates approximately 2,000 Supercharger stations with over 22,000 stalls across the U.S. as of early 2026. The ICCT’s 2024 audit placed Supercharger uptime at approximately 98% — the highest of any measured network and the benchmark against which all third-party performance is compared. NACS open access has expanded meaningfully since 2024: Ford, GM, Rivian, Polestar, Volvo, Mercedes, and Nissan have all confirmed NACS compatibility through native ports or adapters, meaning a growing share of non-Tesla EV owners can now access Superchargers. Geographic coverage is strongest along major interstate corridors and in high-EV-adoption coastal states. However, Supercharger coverage in the Mountain West, Upper Midwest, and Deep South interior remains noticeably thinner than in coastal markets.
Electrify America, EVgo, and Blink: The Third-Party Truth
Electrify America operates approximately 900 stations with over 4,000 DC fast charge ports, primarily targeting highway corridors. Its coverage of I-95, I-5, and I-10 is functional for planned road trips in 2026. However, ICCT audit data placed EA uptime at approximately 85–90% — meaningfully below Supercharger performance. EVgo focuses on urban density with approximately 1,000 stations concentrated in major metros — a model that improves per-session utilization but creates highway gaps where Electrify America dominates. Blink’s network is predominantly Level 2 and therefore relevant for destination and workplace charging rather than road trips. Network interoperability through Plug and Charge (ISO 15118) has improved but remains inconsistently implemented across stations and vehicles in 2026. As a result, session friction — failed payment attempts, connector authentication errors — remains more common on third-party networks than on Supercharger.
← Scroll to see full table on mobile
| Network | U.S. Stations | DC Fast Charge | NACS Access | 2026 Uptime | Primary Zone |
|---|---|---|---|---|---|
| Tesla Supercharger BENCHMARK | ~2,000 | ✅ All stalls | ✅ Open + adapters | ~98% | National highway + urban |
| Electrify America | ~900 | ✅ All DC fast | ✅ CCS + NACS | ~85–90% | Highway corridors |
| EVgo | ~1,000 | ✅ All DC fast | ✅ CCS + NACS | ~88–92% | Urban density |
| ChargePoint | ~35,000+ | ⚠️ Mix (mostly L2) | ✅ CCS / J1772 | Variable | Workplace + destination |
| Blink | ~10,000+ | ⚠️ Mostly L2 | ✅ J1772 / CCS | Below average | Destination / retail |
Wait Times: The Metric Nobody Publishes but Every Driver Experiences
Here’s the thing: charger wait time is the friction that most directly erodes EV owner satisfaction, and it’s the metric almost no infrastructure coverage bothers to quantify. A station that exists and works can still be a 45-minute delay if six other EVs arrived before you. That matters — specifically on holiday road trips and at urban Supercharger locations in high-density markets.
When and Where Waits Are a Real Problem
J.D. Power’s 2024 U.S. Electric Vehicle Experience Charging Study found that wait times at charging stations represented one of the top-three friction points for non-Tesla EV owners, specifically during peak travel periods. Thanksgiving and July 4th holiday windows consistently generate documented queue times of 20–45 minutes at high-utilization Supercharger locations — specifically at stations near interstate exits in popular vacation corridors. Urban Supercharger congestion is a separate problem: high-density cities like Los Angeles, San Francisco, and New York have Supercharger stations where peak evening demand regularly exceeds stall availability, creating wait times that are structural rather than seasonal. Third-party DC fast networks present the inverse situation: lower utilization but higher out-of-service rates, meaning you wait less for a stall but are more likely to find that stall non-functional when you arrive.
Practical Strategies to Avoid Waits in 2026
Departure time planning is the most effective wait-avoidance tool available. Corridor charging between 6 a.m. and 8 a.m. generates significantly shorter waits than midday stops — specifically at high-utilization Supercharger stations on popular travel routes. Tesla introduced stall reservations at select Supercharger locations, allowing vehicles to book a stall in advance through the navigation system. Electrify America and EVgo both offer session scheduling through their apps at participating stations, however adoption across their full network remains limited in 2026. For real-time charger status before committing to a stop, PlugShare’s check-in feature is the most accurate available tool — specifically because it reflects actual driver-reported conditions at a specific station within the past 24 hours, not network self-reported operational status which lags reality. ABRP (A Better Route Planner) integrates real-time PlugShare data into route planning, making it the strongest combined tool for long-distance EV travel planning in 2026.
The Gap Map: Where U.S. EV Charging Still Falls Short in 2026
Not all gaps are equal — and not all of them affect the same buyer. There are four distinct gap categories in the U.S. charging landscape, and which one matters for you depends entirely on your geography, housing situation, and primary vehicle use case.
Rural and Off-Corridor Charging Deserts: Where and Why
The DOE AFDC defines a charging desert as an area with no DC fast charger within a 50-mile radius. According to AFDC mapping data, charging deserts remain concentrated in the Great Plains, Mountain West, and parts of the Deep South — specifically in states like Wyoming, Montana, North and South Dakota, and portions of Kansas and Mississippi. Why do these gaps persist? Three structural causes compound each other: utility interconnection timelines (adding grid capacity to a rural location can take 18–36 months), low projected utilization rates that reduce ROI for private operators, and permitting processes that vary by state and frequently add 12+ months to station delivery timelines. NEVI’s rural deployment obligation specifically targets Alternative Fuel Corridor coverage — however as noted above, the gap between NEVI funding and operational stations remains significant in these geographies as of 2026.
Multi-Unit Dwelling and Apartment Charging: The Invisible Gap
Approximately 35–40% of U.S. households live in multi-unit dwellings without guaranteed dedicated EV charging access, according to U.S. Census Bureau housing data. This gap is, admittedly, more consequential for urban EV adoption at scale than the rural desert problem — because apartment and condo residents in major cities represent a large potential EV buyer pool with zero home charging access. Without Level 2 at home, these buyers depend entirely on public infrastructure for their baseline charging, which dramatically increases their exposure to network reliability and wait time issues. Current partial solutions include destination Level 2 at retail and hospitality locations, and employer workplace charging programs — however neither provides the consistent overnight charging access that home Level 2 delivers, and both depend on infrastructure the owner doesn’t control.
Highway Corridor Gaps That Still Affect Road Trips in 2026
Major interstate corridors — specifically I-95, I-5, and I-10 — are functionally equipped for EV road trips in 2026, particularly for NACS-capable vehicles. The real gap is secondary highways and state routes in the Mountain West, Northern Plains, and Deep South interior, where DC fast charger spacing can exceed 80–120 miles on commonly traveled routes. For EVs with real-world range below 220–250 miles, this creates genuine anxiety margins on non-interstate road trips in these regions. Buyers considering short-range EVs specifically for use in these geographies should audit the AFDC station locator for their specific routes before purchasing.
← Scroll to see full table on mobile
| Gap Type | Who It Affects | Severity 2026 | NEVI Timeline | Practical Workaround |
|---|---|---|---|---|
| Rural charging desert | Rural drivers, Great Plains / Mountain West | High | 2027–2028 est. | Home L2 as primary; 300+ mi range EV |
| MUD / Apartment gap | Urban renters (~35–40% of households) | High | No NEVI solution | Workplace charging; destination L2 |
| Secondary highway gap | Off-interstate road trippers | Moderate | Partial 2027 | Plan around available corridors; ABRP routing |
| Reliability blackspot | Third-party DC fast reliant drivers | Moderate — improving | Operator-dependent | PlugShare check-ins; backup station planned |
Uptime and Reliability: The Number Behind the Number
Station count generates press releases. Uptime determines whether those stations are useful when you need them. This is the section where the honest data diverges most sharply from the optimistic summary — and where experienced EV drivers are least surprised by what the audits find.
What Independent Audits Find on Charger Uptime in 2026
The ICCT’s 2024 unannounced field audit of U.S. public DC fast chargers found approximately 21% of non-Tesla chargers non-functional at time of visit — compared to under 4% for Superchargers in the same assessment. The most common failure modes, in order of frequency: payment terminal errors (card readers failing or requiring app authentication workarounds), connector damage from physical wear and vandalism, software communication failures between the vehicle and charger, and power delivery interruptions from utility or equipment issues. The reliability gap has improved year-over-year — Electrify America and EVgo both showed measurably better uptime in 2024 versus 2022 — however, the 17+ percentage point gap versus Supercharger performance remains the defining structural difference in U.S. DC fast charging in 2026. That gap is why experienced non-Tesla EV owners consistently recommend always identifying the next nearest backup station before committing to any third-party fast charge stop.
How to Check Charger Reliability Before You Arrive
PlugShare’s check-in data is the most reliable real-time proxy for charger condition at a specific station. Specifically, check-ins from within the past 48 hours showing successful sessions indicate functional status more accurately than any network-reported operational status. A pattern of recent check-ins reporting errors or non-functional stalls is a clear warning to route to an alternative. Network apps vary significantly in their failure notification proactiveness: Tesla notifies drivers of Supercharger outages through the navigation system. EVgo and Electrify America both offer in-app notifications, however these depend on the network having updated its own operational data — which lags driver-reported reality. As a result, PlugShare’s crowdsourced approach produces more current information than any single network’s self-reported status. Never rely on a single charger for a time-critical stop on a non-Supercharger route — the 20% out-of-service rate means that on a four-stop route, statistically at least one stop has a meaningful chance of requiring a backup plan.
What This Means for Your EV Decision in 2026
All of the above comes down to one practical question: does the current infrastructure support your specific ownership scenario? Here’s the honest, scenario-matched framework — no hedging, just clear triggers.
The U.S. Charging Network Works Well for You If…
The infrastructure is adequate for your needs if home or reliable workplace Level 2 access is part of your daily life. That single variable reduces your public DC fast charge dependence dramatically — because you start most days with a full or near-full battery and only need public charging for exceptional trips. NACS-native or NACS-adapter access to Superchargers adds a meaningful reliability layer on top of that baseline, because Supercharger uptime is the highest available. As a result, urban and suburban drivers with home charging and NACS access are largely insulated from the friction points documented in this article.
The Network Creates Real Risk for You If…
By contrast, the gaps are consequential if your situation doesn’t include home charging — specifically if you rent an apartment, park on the street, or have no dedicated parking with outlet access. The entire ownership experience for MUD residents depends on public network reliability, which remains the weakest link in the chain. Rural drivers face the secondary gap: if your regular driving routes pass through charging desert geography, range planning becomes a discipline rather than an afterthought, and an EV with under 250 real-world miles requires specific charging stop knowledge that most urban buyers never have to develop.
✅ Network Works for You
- You own your home or have reliable L2 workplace access
- Your vehicle has NACS native or confirmed adapter access
- Daily driving stays within 70–80% of real-world range
- You drive primarily on established interstate corridors
- You use PlugShare/ABRP and plan backup stops on road trips
⚠️ Network Creates Real Risk
- You rent an apartment without dedicated charging access
- You live in a rural area or regularly drive off interstates
- Your primary network will be third-party DC fast charge
- You’re considering a sub-220-mile real-world range EV
- Reliability friction would significantly affect your quality of life
FAQ: EV Charging in the US
Is EV charging widely available in the US in 2026?
It depends on location. Urban and major corridor drivers have largely functional access — over 192,000 public ports exist as of early 2026, with strong coverage on established interstate routes. However, genuine gaps persist in rural areas, the Mountain West, Northern Plains, and Deep South interior where charging deserts remain common. The honest answer is that wide availability exists on a map but not uniformly in practice — your specific routes and geography determine which experience you have.
How long do you typically wait for an EV charger in the US?
For most drivers at off-peak times, the wait is zero — stalls are available and functional. However, J.D. Power’s 2024 EV Charging Satisfaction Study identified wait times as a top-three friction point for non-Tesla owners during peak travel periods. Holiday corridor charging — specifically Thanksgiving and July 4th on popular vacation routes — generates documented queue times of 20–45 minutes at high-utilization stations. Departure time planning (early morning vs. midday stops) and real-time PlugShare checks reduce this significantly.
What percentage of U.S. EV chargers are out of service at any given time?
According to ICCT’s 2024 unannounced field audit, approximately 21% of non-Tesla DC fast chargers were non-functional at time of visit — compared to under 4% for Superchargers. That 17-point gap is the largest measurable performance difference between the networks and the primary reason experienced EV drivers route through Superchargers when possible. Uptime has improved year-over-year, however the gap versus Supercharger reliability remains significant as of 2026.
Is the U.S. EV charging network good enough to buy an EV in 2026?
For most urban and suburban buyers with home charging access, yes — the network is adequate. Home Level 2 charging handles 85–90% of daily charging needs, and public infrastructure fills the rest. For apartment dwellers without home charging access or rural buyers in charging desert geographies, the honest answer is that real friction remains. The decisive variable is home charging access — buyers who have it are largely insulated from the network’s current gaps; buyers who don’t face those gaps directly in daily ownership.
The Bottom Line on EV Charging in the US in 2026
The truth about EV charging in the U.S. in 2026 is simultaneously more functional than its critics claim and less ready than its advocates promise — and the gap between those two realities is determined almost entirely by where you live and which network you depend on. The two decisive variables are home charging access and NACS network access. Drivers who have both are largely insulated from the coverage, reliability, and wait time problems documented in this article. The network is improving faster than public perception tracks — NEVI delivery, NACS expansion, and measurable uptime improvement are all real, even if incomplete. Before making any EV purchase decision based on charging access, audit your own routes using PlugShare’s 3-month check-in data — not the station count map — for every stop you would realistically rely on. Understanding the total monthly cost of EV ownership including public charging completes the financial picture this infrastructure assessment is protecting.