Last Updated: May 2026 — AFDC/DOE charger counts, J.D. Power 2024 EVX Public Charging Study, EIA electricity rates, NEVI program status
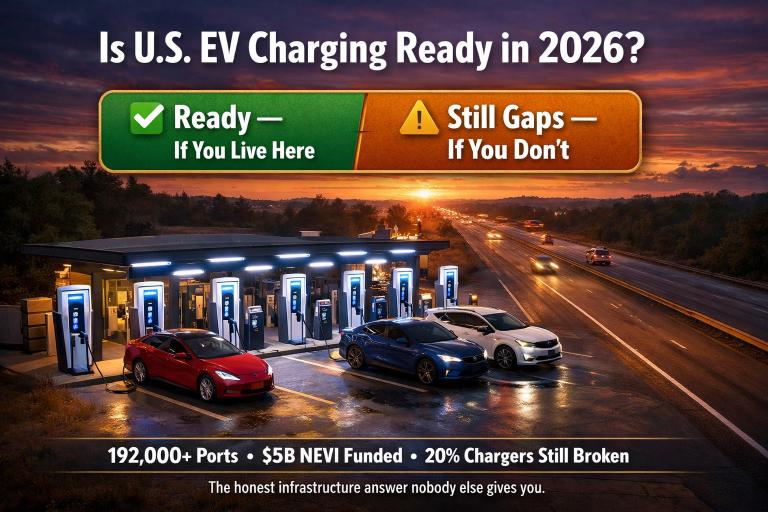
EV charging infrastructure in the US in 2026 clears the bar for the majority of EV owners — and falls short for a specific minority whose situation is rarely acknowledged in the debate. The US has approximately 64,000 public DC fast charging ports and over 180,000 Level 2 public stations, according to the Alternative Fuels Data Center. For a driver who charges at home overnight and occasionally uses public chargers on road trips, that network is more than adequate on any major corridor. For a driver in an apartment without home charging access, or anyone routing through rural Montana or the Appalachian interior, the infrastructure is still materially incomplete. The question “is EV charging ready?” has two honest answers depending entirely on where you live and how you charge.
Is EV Charging in the US Ready in 2026? — The Short Answer:
For urban and suburban EV owners with home or workplace charging: yes — the network is reliable enough on major corridors and most cities have adequate coverage. For apartment dwellers relying on public charging, or drivers on rural and secondary routes: not consistently. The core problem is not the number of chargers but reliability: J.D. Power’s 2024 EVX study found that approximately 21% of non-Tesla DC fast charging sessions are abandoned due to charger malfunction or unavailability. Tesla Supercharger maintains approximately 99% uptime on the same metric. The gap between the best and worst charging experiences in the US is wider than in any other major EV market.
The Numbers Behind the Network: What the US Actually Has
Total charger counts tell an optimistic story; functional reliability tells a more complicated one. The AFDC database tracks approximately 64,000 public DC fast charge ports and 180,000+ Level 2 public ports across roughly 60,000 stations. That represents more than a doubling of DC fast charge capacity since 2021. The federal NEVI (National Electric Vehicle Infrastructure) program allocated $7.5 billion across all 50 states with approved spending plans — highway corridor coverage is the primary focus, with stations required every 50 miles along designated Alternative Fuel Corridors.
The ratio that matters for a prospective EV buyer: there are approximately 4.5 million registered EVs in the US as of early 2026. Divided by 64,000 DC fast charge ports, that is roughly one public fast-charge port per 70 EVs. By comparison, Norway has approximately one fast-charge port per 12 EVs. The absolute numbers in the US are growing faster than in almost any other country, but the ratio to the vehicle fleet is still the weakest among major EV markets. The NEVI target of 500,000 public chargers by 2030 would close this gap substantially — at current registration rates, that would put the ratio at approximately one port per 18–22 EVs.
The Level 2 public network is largely adequate for destination charging — hotels, shopping centres, workplaces — but Level 2 adds 15–30 miles per hour and is not a practical option for mid-trip top-ups on road journeys. DC fast charging is what determines road-trip feasibility, and the DC network’s geographic distribution and reliability are the two variables that determine whether the infrastructure answer is “yes” or “not yet.”
Network-by-Network: Reliability, Speed, and Price
The US public charging landscape is fragmented across five major non-Tesla networks and Tesla’s own Supercharger system, which opened to non-Tesla vehicles via the NACS adapter in 2024. Each network has distinct reliability profiles, pricing structures, and geographic footprints. Understanding these differences is more useful than the aggregate charger count alone.
| Network | US DC Ports (approx.) | Max Speed | Avg Price / kWh | Reliability | Best For |
|---|---|---|---|---|---|
| Tesla Supercharger MOST RELIABLE | ~20,000 stalls | 250–500 kW (V3/V4) | $0.25–$0.36 | ~99% uptime | Road trips; widest corridor coverage |
| Electrify America | ~4,000 ports | 150–350 kW | $0.43–$0.56 | Improving; ~80–85% uptime | VW/Hyundai/Kia owners; highway corridors |
| EVgo | ~3,500 ports | 50–350 kW | $0.39–$0.49 | ~85% uptime (urban-focused) | Urban top-ups; retail locations |
| ChargePoint | ~5,000 DC ports (~40K L2) | 62–62.5 kW (most units) | $0.30–$0.45 | ~78% uptime (DC units) | Destination/workplace L2 charging |
| Blink | ~1,500 DC ports | 50–80 kW | $0.39–$0.59 | ~70% uptime | Destination/hotel; not road trips |
Tesla Supercharger’s reliability advantage comes from vertical integration: Tesla designs, installs, and maintains its own hardware and software stack, with remote monitoring of every stall. Non-Tesla networks typically use third-party hardware from multiple manufacturers installed by contractors and maintained by network operations teams — a more fragmented model that creates more points of failure. Several non-Tesla networks have improved significantly since 2022, but the reliability gap with Tesla remains the most consequential single data point in the US EV charging picture.
The pricing gap between networks is also material. A 200-mile road trip requiring 40 kWh of public DC fast charging costs approximately $10–$14 on Tesla Supercharger, $17–$22 on Electrify America, and $16–$24 on Blink. The same energy delivered at home costs approximately $5.50. Public DCFC road-trip costs in the US are now comparable to petrol costs for a 30–35 MPG ICE vehicle — a point that matters for buyers who assumed EVs would be dramatically cheaper to fuel regardless of where they charge.
Where EV Charging in the US Works and Where It Doesn’t
Geography is the clearest dividing line in US charging infrastructure readiness. The coasts, the Sun Belt, and the main east-west and north-south interstate corridors have dense coverage with multiple competing networks. The northern plains, rural Appalachia, and secondary routes through the Mountain West have meaningful gaps — stretches of 100+ miles between any DC fast charger are still documented in Montana, Wyoming, North Dakota, and parts of Idaho and Alaska.
| Region / State | DCFC Coverage | Primary Networks | Corridor Gaps | Readiness |
|---|---|---|---|---|
| California | ~15,000+ DC ports | Tesla, EA, EVgo, ChargePoint | Minimal on interstates | EXCELLENT |
| Northeast (NY, MA, NJ) | Dense urban + I-95 | Tesla, EVgo, EA | None on I-95; some on I-87/I-91 | STRONG |
| Texas corridors (I-10, I-35) | Improving rapidly | Tesla, EA, ChargePoint | West Texas I-10 gaps remain | GOOD |
| Southeast (FL, GA, SC) | I-95 well-covered | Tesla, EA | I-75 interior gaps; rural FL sparse | ADEQUATE |
| Midwest (OH, IN, IL, MI) | I-90/I-80/I-70 covered | Tesla, EA, EVgo | Rural secondary routes sparse | ADEQUATE |
| Northern Plains (MT, WY, ND) | I-90/I-94 basic | Tesla (limited), NEVI new installs | 100–200 mi gaps on secondary routes | GAPS REMAIN |
| Rural Appalachia (WV, eastern KY) | Sparse | Tesla (major routes only) | Significant off-interstate gaps | NOT READY |
NEVI implementation is filling corridor gaps on federally-designated routes, but the requirement is coverage every 50 miles on the designated Alternative Fuel Corridors — not on all roads. A buyer living in rural Wyoming 80 miles from the nearest interstate may gain NEVI-funded coverage on the interstate but still face a dead zone on their regular routes. The NEVI program was designed to solve the road-trip problem for people near major highways; it was not designed to solve the access problem for rural residents.
The Reliability Problem: Why 1 in 5 Non-Tesla Fast Chargers Fails
The most significant finding in J.D. Power’s 2024 Electric Vehicle Experience Public Charging Study is not about speed or price — it is about session completion. Approximately 21% of non-Tesla DC fast charging sessions were abandoned because the charger malfunctioned, was offline, or could not communicate with the vehicle’s payment system. For Tesla Supercharger, the equivalent figure is below 2%.
The failure modes are consistent across network audit data: connector damage (the CCS plug takes more physical abuse than the NACS connector due to its size), payment system timeouts, network communication errors that prevent session initialisation, and power cabinet failures in older hardware. Sites that were installed under 2020–2021 federal grant programmes are now reaching the end of their original maintenance cycles without a consistent replacement or upgrade pipeline.
Electrify America has invested significantly in hardware upgrades and remote monitoring since its widely-reported reliability problems in 2022–2023, and its reported uptime has improved from roughly 70% to approximately 83–85% by 2025. That improvement is real but still means roughly 1 in 6 Electrify America sessions encounters a problem — not a confidence-inspiring figure for a driver 200 miles from home with 40 miles of range remaining. EVgo’s urban-focused deployment model (retail parking structures, urban garages) has generally produced better uptime than highway-corridor deployments, where hardware is more exposed to weather and vandalism.
What EV Charging Costs on the Road vs at Home in 2026
Home charging costs and public charging costs are not the same number, and the difference is large enough to affect the ownership calculus for heavy road-trippers. At the US average electricity rate of $0.138/kWh, a full charge for a 75 kWh battery costs approximately $10.35 at home. The same 75 kWh on Electrify America at $0.48/kWh costs $36.00. That 3.5× difference narrows the EV fuel savings case significantly for buyers who cannot home-charge.
| Charging Source | Avg Price / kWh | Full Tank Equiv. (75 kWh) | Annual Fuel Cost | vs 25 MPG ICE ($3.40/gal) |
|---|---|---|---|---|
| Home (national avg) CHEAPEST | $0.138 | ~$10.35 | ~$473 | Save ~$1,163/yr |
| Tesla Supercharger | $0.28–$0.36 | ~$21–$27 | ~$960–$1,234 | Save $402–$676/yr |
| Electrify America | $0.43–$0.56 | ~$32–$42 | ~$1,474–$1,920 | No saving or costs more |
| Blink (peak rates) | $0.48–$0.59 | ~$36–$44 | ~$1,646–$2,023 | Costs more than petrol |
| ICE at 25 MPG ($3.40/gal) | — | — | ~$1,632 | Baseline |
The table above makes a point that most EV coverage articles avoid: a driver charging exclusively on Electrify America or Blink at peak rates pays more per mile than they would driving a 25 MPG petrol vehicle at $3.40/gallon. The EV fuel savings case is dependent on home charging. A buyer without home charging access who relies on public networks does not automatically save money on fuel — and may spend more. This is not a reason not to buy an EV, but it is a reason to audit your charging access honestly before purchasing. The full monthly EV versus ICE cost comparison with state-by-state electricity rates is covered in the monthly car cost breakdown.
Who the Current EV Charging Infrastructure Serves — and Who It Doesn’t
The infrastructure question is really a lifestyle question. Two buyers can look at the same network data and reach opposite conclusions, because their charging access is different. The decision framework below is designed to make that distinction explicit before purchase rather than after.
EV charging works well for you if…
- You have a home outlet (120V or 240V) or reliable workplace charging
- You live in or near a major metro area with multiple competing networks
- Your road trips follow major interstate corridors (I-95, I-10, I-80, I-40)
- You drive a vehicle compatible with NACS (or have an adapter) for Supercharger access
- You use PlugShare or a network app to verify charger status before departing
The infrastructure falls short for you if…
- You live in an apartment, condo, or rental with no dedicated charging access
- You regularly drive secondary or rural routes in the northern plains or Appalachia
- You depend on non-Tesla public DCFC for more than 30% of your annual miles
- You need to charge reliably in Montana, Wyoming, North Dakota, or rural West Virginia
- You cannot plan charging stops in advance or tolerate occasional charger failures
The apartment-dweller problem deserves specific attention. Approximately 30% of US households do not have a private driveway or garage. For these buyers, EV ownership depends entirely on public charging access — either a charging-enabled parking space in their building, nearby street charging, or public networks. Building charging installation has accelerated through HOA policy changes and state mandates (California, Colorado, and New York have passed EV charging access laws), but the majority of multi-family buildings still lack dedicated resident charging infrastructure. This is the single largest structural barrier to EV adoption for the next 20 million potential US EV buyers, and the NEVI highway corridor programme does not address it. The cost of home charging installation — including the $1,000 federal tax credit and the Level 1 vs Level 2 decision — is covered in the home EV charging guide.
Frequently Asked Questions About EV Charging in the US in 2026
Is EV charging infrastructure ready in the US in 2026?
For EV owners with home charging and driving patterns that follow major interstate corridors, yes. The US has approximately 64,000 public DC fast charge ports with improving coverage on designated highway corridors under the NEVI programme. For apartment dwellers without home charging access, or drivers on rural and secondary routes in the northern plains and Appalachia, infrastructure gaps remain material. The average non-Tesla DCFC failure rate of approximately 21% per session (J.D. Power 2024) means unreliable access is still a realistic planning concern outside Tesla’s Supercharger network.
How many public EV chargers does the US have in 2026?
According to the Alternative Fuels Data Center (AFDC/DOE), the US had approximately 64,000 public DC fast charge ports and over 180,000 Level 2 public charge ports across roughly 60,000 stations as of early 2026. Tesla Supercharger accounts for approximately 20,000 of the DC fast charge stalls. The network has roughly doubled in DC fast charge capacity since 2021, but the ratio of chargers to registered EVs (approximately 4.5 million) remains lower than in Norway, the UK, and the Netherlands.
Which EV charging network is most reliable in the US?
Tesla Supercharger is the most reliable public DC fast charging network in the US by a significant margin, with approximately 99% uptime versus approximately 79–85% for non-Tesla networks according to J.D. Power 2024 EVX data. Tesla’s advantage stems from vertical integration — it designs, owns, and maintains its own hardware and software. Electrify America has improved substantially since 2023 and now sits at approximately 83–85% uptime. Blink has the weakest reliability among major networks at approximately 70% uptime on DC fast chargers.
How much does EV charging cost at a public charger vs at home?
Home charging at the US average of $0.138/kWh costs approximately $10.35 for a 75 kWh full charge. The same charge on Tesla Supercharger costs $21–$27. On Electrify America, $32–$42. At Blink peak rates, $36–$44. At Electrify America and Blink prices, the per-mile fuel cost of an EV equals or exceeds the fuel cost of a 25 MPG petrol vehicle at $3.40/gallon. The fuel savings case for EVs depends substantially on home charging access — it is not automatic from public charging alone.
Can non-Tesla EVs use Tesla Superchargers?
Yes, since 2024 Tesla Supercharger stations are open to non-Tesla vehicles via a NACS adapter. Most major 2025–2026 model year EVs (Ford, GM, Honda, Nissan, Rivian, Volvo, and others) have adopted the NACS port natively. Hyundai and Kia offer adapters for their CCS-equipped vehicles. The adapter typically costs $200–$250. Tesla charges non-Tesla drivers slightly higher per-kWh rates than Tesla subscribers but lower rates than most competing networks at comparable speeds. The Supercharger network’s 20,000 US stalls and 99% uptime make NACS compatibility one of the most practical factors to confirm before purchasing a new EV.
What is the NEVI programme and how does it affect EV charging?
NEVI (National Electric Vehicle Infrastructure) is a $7.5 billion federal programme allocating charging infrastructure funds across all 50 states. It requires stations every 50 miles on federally-designated Alternative Fuel Corridors, with each station providing at least 150kW DC charging and four or more ports. All 50 states have approved NEVI spending plans. The target is 500,000 public chargers by 2030. NEVI focuses on highway corridor coverage — it does not address urban multi-family access or rural secondary road gaps. The practical benefit for most buyers is improved reliability on established interstate road trips over the next 2–4 years.
Should I buy an EV if I live in an apartment without home charging?
With caution. Approximately 30% of US households lack a private garage or driveway. Without home charging, EV ownership depends entirely on public network availability and pricing. At public DC fast charge rates ($0.39–$0.59/kWh), annual fuel costs equal or exceed a petrol vehicle. Reliability of non-Tesla public DCFC at roughly 79–85% uptime means occasional failed charging sessions are a realistic expectation. Some states (California, Colorado, New York) now mandate EV charging access in multi-family buildings, and this is changing faster in urban markets. If your building has or is planning Level 2 charging, or if you work near a reliable network, the situation is manageable. If neither applies, wait or consider a plug-in hybrid as an intermediate step.
How long does it take to charge an EV at a public DC fast charger?
At a Tesla V3 Supercharger (250kW) or compatible 350kW Electrify America station, vehicles capable of drawing those speeds can add 150–200 miles in 15–25 minutes. At the most common public rapid chargers (50–150kW), a 10–80% charge for a 75 kWh battery takes 35–60 minutes depending on the vehicle’s DC charging ceiling. At Level 2 public stations (7–19 kW), the same charge takes 3–8 hours — practical for destination charging at hotels or shopping centres but not for mid-trip top-ups. DC fast charging speed by vehicle is covered in the affordable EV 2026 comparison.