The EV range vs advertised range gap is the most financially consequential number most buyers never calculate before signing. Electric vehicle manufacturers publish range figures derived from controlled laboratory test cycles — and those numbers rarely survive contact with a motorway, a cold morning, or an air-conditioned summer commute. Understanding the real gap, what drives it, and how to model your actual usable range is the difference between a satisfying ownership experience and chronic range anxiety.
This guide explains exactly where official figures diverge from real-world results in 2026, which conditions create the largest gaps, and how to make a purchase decision based on the range your car will actually deliver — not the number on the window sticker.
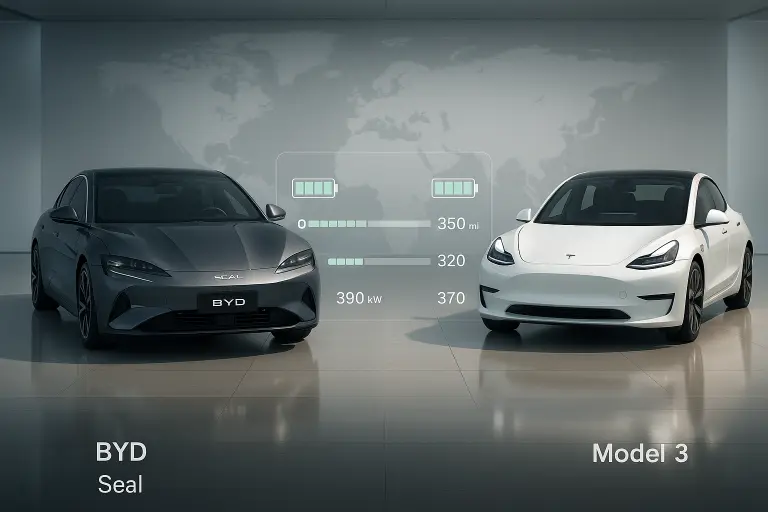
EV Range vs Advertised Range — What the Numbers Really Mean
• 75–82% of WLTP certified range
• 78–85% of EPA certified range
• 70–78% of CLTC certified range
Figures apply at sustained 110–120 km/h in 15–20°C ambient temperature. Winter and high-speed conditions reduce these further — see sections below.
No major EV market uses a single standard. The figure on any electric vehicle’s spec sheet is determined by which testing protocol the manufacturer used — and those protocols vary significantly in their real-world accuracy.
EPA vs WLTP vs CLTC Testing Standards
The EPA cycle (used in the United States) runs at relatively modest speeds with frequent stops, producing figures that typically land 10–15% below WLTP. WLTP (used in Europe, Australia, and most international markets) runs at higher average speeds than the older NEDC standard but still reflects conditions more optimistic than sustained motorway driving. CLTC (China’s standard) is the most generous of the three — real-world gaps of 20–30% below CLTC figures are common for Chinese EVs tested under domestic certification. When comparing advertised ranges across brands, always confirm which standard was used. An “EPA 300 miles” figure and a “WLTP 480 km” figure are not directly comparable — and both still overstate highway reality.
Controlled Test Conditions vs Real Driving
Laboratory tests are conducted at moderate temperatures (typically 23°C), at controlled speeds, with no cargo, no HVAC use, and no accessory load. Real driving adds all of these simultaneously. A driver at 120 km/h in January with the heated seats, defrost, and navigation running is operating in conditions that no certification cycle was designed to replicate. This is not a manufacturer deception — it is a structural limitation of standardized testing. The gap is predictable and quantifiable.
Why 2026 EV Software Updates Affect Range
OTA software updates have introduced a new variable into range calculations that didn’t exist in the ICE era. Manufacturers including Tesla, BYD, and Xpeng have delivered meaningful efficiency improvements — and occasional regressions — through firmware updates post-purchase. Battery energy management, regenerative braking calibration, and thermal preconditioning logic are all software-defined in modern EVs. A car bought in Q1 2026 may have measurably different real-world range by Q3 2026 depending on update cadence. This cuts both ways: efficiency gains are possible, but range can also decrease if a thermal management update prioritizes battery longevity over short-term output.
Why Real-World EV Range Is Lower (Most of the Time)
Four variables account for the majority of the gap between advertised and delivered range. Speed and aerodynamics dominate at highway speeds; temperature dominates in cold climates; HVAC load is underestimated by most buyers; and terrain adds a final, often overlooked variable.
Highway Speeds & Aerodynamic Drag at 70–75 MPH
Aerodynamic drag increases with the square of speed — which means the range penalty for driving at 120 km/h vs 100 km/h is disproportionately larger than the 20 km/h difference implies. At sustained 120 km/h, efficiency falls to 75–82% of the WLTP figure for most EVs. SUV-profile EVs with drag coefficients above 0.28 Cd may fall below 70% at the same speed. The practical planning rule: subtract 3–5% from your expected WLTP range for every 10 km/h above 100 km/h. The speed-by-speed reference table is in the dedicated highway section below.
Cold Weather, Heat Pumps & Battery Thermal Management
Lithium-ion cells — both LFP and NMC — lose electrochemical efficiency below 5°C and degrade substantially below -10°C. Heating the cabin from an electric resistive heater draws 3–5 kW continuously, consuming energy at a rate that compresses available range by 20–35% in sub-zero conditions. Heat pumps, now standard on most mid-range and premium EVs, reduce that penalty to approximately 10–20% in moderate cold (-5°C to 5°C) by extracting ambient heat rather than generating it electrically. Below -15°C, even heat pump systems lose efficiency and resistive backup heating engages. For buyers in Northern Europe, Canada, or high-altitude regions, cold-weather range planning is not optional.
HVAC Use, Payload & Terrain Impact
Air conditioning in summer draws 1–2.5 kW depending on ambient temperature and cabin size — reducing range by roughly 8–15% on a 35°C day with moderate use. A full passenger load (four adults plus luggage) adds approximately 250–350 kg, increasing rolling resistance and reducing range by 5–10% relative to a solo-driver test. Hilly terrain compounds both effects. Regenerative braking partially recovers descent energy, but the net effect of significant elevation gain is always negative on range — expect 10–20% reduction on routes with cumulative elevation gain above 500m.
Figures represent estimated range reduction from WLTP-rated capacity. Conditions often combine — winter highway driving with HVAC active can produce cumulative reductions of 35–45%. Based on aggregated real-world testing benchmarks.
EV Range vs Advertised Range — Financial Impact
The range gap is not just an inconvenience metric. It has direct, calculable financial consequences across charging frequency, electricity cost, and long-term resale value.
More Frequent Charging & Time Cost
A driver expecting 400 km of usable range who actually gets 310 km on a regular highway route needs to charge approximately 29% more frequently over the same annual mileage. At public DC fast charger rates — typically £0.65–£0.79/kWh in the UK and €0.55–€0.75/kWh across EU markets — the cost differential between home and public charging is significant. If the range gap forces even two additional public charging sessions per month (each at a 45-minute DC charger), the annual time cost runs to 18 hours and the additional charging cost adds £150–£220 per year at current UK rates.
Electricity Cost per Mile vs Expected Range
Advertised efficiency figures face the same optimism bias as range. An EV rated at 16 kWh/100 km under WLTP will typically consume 19–22 kWh/100 km at sustained 120 km/h in mild weather, and 22–27 kWh/100 km in winter conditions. At UK home charging rates of approximately £0.24/kWh, that difference translates to a real-world per-mile electricity cost that runs 20–40% higher than the headline figure suggests. Over 15,000 km annually, this adds £180–£320 to operating cost versus the advertised efficiency figure. See our guide on monthly EV ownership costs for a full running cost breakdown.
Resale Value & Range Degradation Concerns
Battery capacity degrades over time — typically 2–4% per year for well-managed LFP packs, 3–5% annually for NMC under frequent DC fast charging. A 400 km WLTP car with 10% capacity loss after three years delivers 360 km rated range — before the real-world discount is applied. Buyers purchasing used EVs should request a battery state-of-health report and apply the full real-world multiplier to the remaining rated range, not the original advertised figure. This is particularly relevant in the growing used Chinese EV market, where resale pricing hasn’t yet stabilised around degradation-adjusted values. For a detailed look at how long EV batteries last, including capacity retention curves by chemistry, see our dedicated guide.
| EV Segment | Typical WLTP Range | Real Highway Range | Winter Estimate | Difference |
|---|---|---|---|---|
| Budget compact (e.g. MG4 SR) | 350 km | ~270–295 km | ~200–230 km | −16–23% |
| Mid-range crossover (e.g. BYD Atto 3) | 420 km | ~330–350 km | ~250–290 km | −17–21% |
| Premium sedan (e.g. BYD Han EV) | 521 km | ~410–430 km | ~320–360 km | −17–21% |
| Performance SUV (e.g. Xpeng G9) | 520 km | ~385–415 km | ~285–330 km | −20–26% |
| Large premium (e.g. Tesla Model S LR) | 628 km EPA | ~480–510 km | ~360–410 km | −19–24% |
Real-world range estimates based on aggregated third-party testing at 110–120 km/h in mild weather. Winter estimates apply to temperatures between -5°C and -10°C with HVAC active. Individual results vary by driving style, route, and software version.
How Much Does EV Range Drop on the Highway? (Speed Reference Table)
The physics of aerodynamic drag — covered above — translate directly into predictable, quantifiable range loss at each speed band. The table below converts that relationship into a practical planning reference, based on standardised consumption benchmarks from EV Database highway test data across 40+ current models.
| Speed | % of WLTP Range (avg. EV) | % of WLTP Range (aero-optimised, Cd <0.23) | Practical Rule |
|---|---|---|---|
| 90 km/h (56 mph) | 88–93% | 91–95% | Near peak efficiency — minimal penalty |
| 100 km/h (62 mph) | 83–89% | 87–92% | WLTP baseline speed — small gap |
| 110 km/h (68 mph) | 80–86% | 83–89% | Standard motorway — apply 0.83 multiplier |
| 120 km/h (75 mph) | 75–82% | 80–85% | UK/EU limit — apply 0.78 multiplier |
| 130 km/h (81 mph) | 68–76% | 72–80% | Autobahn speeds — apply 0.72 multiplier |
Ranges represent mid-segment estimates. Aerodynamically optimised models include Hyundai IONIQ 6 (Cd 0.21), Tesla Model 3 (Cd 0.23), Mercedes EQS (Cd 0.20). SUV-profile EVs typically fall toward the lower bound of each band. Data: EV Database consumption benchmarks, standardised conditions.
EV Winter Range Loss — Real Percentages by Temperature
Cold weather affects EV range through two independent mechanisms: reduced battery electrochemical efficiency and increased cabin heating demand. Both are significant. Together, they create the largest real-world range gap most buyers ever encounter.
At 0°C to -5°C with a heat pump active: expect 12–18% range reduction from the mild-weather highway figure. At -5°C to -15°C with heat pump: 18–28% reduction. At -15°C and below, where resistive backup heating engages: 28–40% reduction. Without any heat pump (older or budget EVs): add 8–12% to each band above. Battery preconditioning — available on most 2024–2026 EVs and activated automatically when navigation routes to a DC charger — recovers 5–10% of the cold-weather penalty by warming cells to operating temperature before arrival.
How to Estimate Realistic EV Range Before Buying
The single most useful thing any prospective EV buyer can do is calculate their own realistic range figure before visiting a showroom — not after. Use the calculator below to generate a personalised estimate in under 30 seconds.
Adjusting EPA Range for Your Driving Style
Mixed urban/highway, mild climate: Advertised Range × 0.82–0.87
Mostly urban, temperate climate: Advertised Range × 0.88–0.93
Apply an additional −15% for winter climates. Apply −10% for vehicles without heat pumps.
A driver who primarily commutes at 120 km/h on dual carriageways in a Northern European climate should apply the 0.75 multiplier, then subtract a further 15% for seasonal cold exposure. An Atto 3 with 420 km WLTP range becomes approximately 268 km of realistic usable range in that scenario — a figure that completely changes the charging infrastructure calculus. This calculation takes under a minute and eliminates the most common source of post-purchase EV disappointment.
Using Real-World Testing Data & Owner Reports
Third-party sources provide more useful benchmarks than manufacturer figures. Bjørn Nyland’s standardized 1,000 km challenge data, EV Database’s consumption figures, and owner communities on regional forums all contribute validated real-world consumption data across conditions. When researching a specific model, search for “real-world range [model name] highway” before relying on the official spec sheet. Pay particular attention to results from your climate region — Nordic winter data is irrelevant to an Australian buyer, and vice versa.
Choosing the Right Battery Size for Daily Commutes
Range anxiety is almost always a battery sizing problem, not a technology problem. A buyer whose longest regular day is 120 km doesn’t need a 500 km WLTP car — they need a car whose real-world range comfortably exceeds 120 km after applying the appropriate multiplier. Oversizing the battery adds purchase cost, weight, and charging time without proportional daily benefit. For drivers covering under 100 km/day with home charging access, a 300–350 km WLTP car is almost always sufficient. The EV range anxiety guide covers this sizing framework in detail for different commuter profiles.
Range Retention Index (RRI) — 2026 Rankings
To make model comparisons actionable and consistent, we apply a single metric throughout this analysis: the Range Retention Index (RRI), defined as:
A higher RRI indicates better real-world efficiency at motorway speeds.
RRI is calculated from mid-point real-world range estimates against certified WLTP or EPA figures. Source benchmarks: EV Database highway consumption data and third-party road test aggregates.
RRI is a more useful purchasing filter than raw range figures, because it tells you how honestly a manufacturer’s certification figure translates to your actual driving. A 600 km car with an RRI of 75 delivers less real-world motorway range than a 500 km car with an RRI of 86.
| Model | Certified Range | Real Highway Range | RRI Score |
|---|---|---|---|
| Hyundai IONIQ 6 LR RWD | 614 km WLTP | ~520–540 km | RRI 86–88 |
| Tesla Model 3 LR RWD | 602 km WLTP | ~500–520 km | RRI 83–86 |
| BYD Han EV | 521 km WLTP | ~410–430 km | RRI 79–83 |
| BYD Atto 3 | 420 km WLTP | ~330–350 km | RRI 79–83 |
| MG4 Extended Range | 452 km WLTP | ~350–370 km | RRI 77–82 |
| Xpeng G6 LR AWD | 570 km WLTP | ~440–465 km | RRI 77–82 |
RRI figures based on sustained 110–120 km/h, 15–20°C ambient, single occupant, HVAC in eco mode. Benchmarks derived from EV Database consumption data and aggregated independent road tests. Results vary by trim level, tyre specification, and software version. RRI is a DriveAuthority analysis metric for comparative purposes.
Should Range Be Your Top Buying Factor in 2026?
Range dominates EV marketing and buyer conversations — but for most daily drivers, it is not the most important purchase criterion. Charging access and speed often matter more than headline range, because a car that charges quickly and conveniently at home renders range anxiety largely irrelevant.
Urban Drivers vs Long-Distance Commuters
For buyers whose daily driving is under 80 km with reliable home charging, a 300 km WLTP car is functionally equivalent to a 500 km car in everyday use. The meaningful difference between these buyers only emerges on occasional long journeys — where charging speed becomes the primary variable, not range. Conversely, for buyers regularly covering 250–350 km in a single leg without the option to charge at the destination, real-world range is the critical purchase filter and should be calculated precisely using the formula above.
When a Hybrid Might Be More Practical
If your regular driving includes frequent long-distance journeys without reliable fast-charging access, a plug-in hybrid may deliver better real-world utility than a pure EV at the same price point in 2026. PHEVs eliminate range anxiety entirely for long trips while still delivering EV efficiency for the majority of shorter urban driving. The EV vs Hybrid vs PHEV comparison covers total cost and use-case fit in detail.
Balancing Range, Charging Speed & Cost
The optimal EV purchase decision in 2026 treats range, charging speed, and total ownership cost as a triangle — optimising one without considering the others produces poor outcomes. A car with 600 km of real-world range but slow 50 kW DC charging will perform worse on a 700 km journey than a 400 km car with 250 kW charging capability. Buyers should calculate the three-variable combination that fits their specific use case rather than maximising any single metric.
- Daily mileage: Calculate your 95th-percentile day — not your average day. Size the battery to handle the longest regular trip comfortably, with a 15–20% buffer for winter.
- Charging access: Confirm home charging capability before purchase. If relying on public charging, map DC fast charger density on your regular routes using the current network, not projected expansion.
- Seasonal climate impact: Apply the winter multiplier relevant to your region before evaluating any model’s range adequacy. Buyers in Scotland, Scandinavia, or Central Europe should plan around the cold-weather figure as the baseline, not the WLTP headline.
Best EVs If You Drive 70+ Miles Daily
If real-world highway range is your primary filter, the models with the highest retention percentages at sustained motorway speeds are your shortlist. Based on the retention data above, the Hyundai IONIQ 6 Long Range RWD and Tesla Model 3 Long Range consistently deliver 83–88% of their certified range at 110–120 km/h — the strongest performance in this segment. For buyers specifically focused on Chinese EV options with strong highway range, the BYD Han EV’s 410–430 km real-world figure at 120 km/h makes it the only Chinese model in this comparison that comfortably handles 350 km single-leg journeys with a usable buffer. The MG4 Extended Range and BYD Atto 3 are better suited to mixed or urban-dominant driving profiles where the efficiency gap narrows significantly. See our full guide to the best EVs for long daily commutes for a complete breakdown by mileage band.
FAQs — EV Range vs Advertised Range
Why is my EV not reaching its advertised range?
Advertised range is measured under controlled laboratory conditions — moderate temperature, low speed, no HVAC, no cargo. Real-world driving combines higher speeds, temperature extremes, passenger load, and accessory use. Most drivers should expect 75–85% of the WLTP figure under normal conditions. This is not a fault — it is the structural gap between certification testing and real driving.
How much range do EVs lose in winter 2026?
Without a heat pump, expect 20–35% range reduction in temperatures between -5°C and -15°C. With a heat pump (standard on most 2024–2026 EVs), the reduction narrows to 10–20% in moderate cold. Below -15°C, even heat pump systems lose efficiency and resistive backup heating increases the penalty. Pre-conditioning the battery while plugged in recovers some winter range.
Is EPA range accurate for highway driving?
No — the EPA cycle underestimates highway efficiency loss at sustained 70–75 mph. At those speeds, most EVs deliver 78–85% of their EPA figure. The EPA’s own MPGe methodology uses a combined cycle that blends city and highway driving. For motorway-heavy commuters, EPA range is a useful upper bound, not a working planning figure.
How much buffer should I subtract from EPA range?
Use a 0.75–0.80 multiplier for sustained highway driving above 110 km/h. Apply 0.82–0.87 for mixed urban and highway use in mild weather. Subtract a further 15% for cold-climate winter use. Plan your charging stops around 80% of your calculated real-world figure — not the full advertised range — to preserve battery longevity and avoid unexpected shortfalls.