Last Verified: March 2026
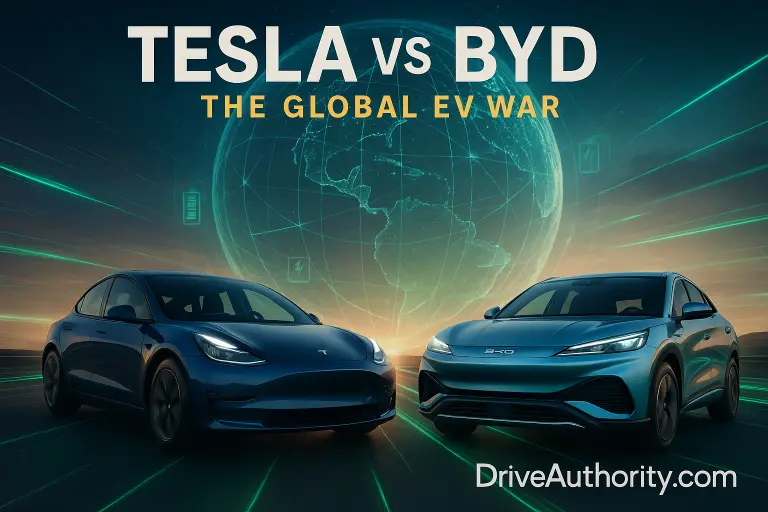
Tesla vs BYD in 2026 is the most consequential rivalry in the history of the automotive industry — and it’s not even close to settled. In 2024, BYD sold 4.27 million vehicles globally versus Tesla’s 1.79 million. That headline makes it sound like the race is over. It isn’t. However, the gap in pure BEV sales tells a very different story: Tesla sold approximately 1.79 million fully electric vehicles versus BYD’s 1.76 million BEVs. The gap is razor-thin when you strip out BYD’s massive PHEV volume. This article breaks down exactly where each company wins, where each falls short, and what the data actually means for the global EV market in 2026.
Why This Comparison Matters More Than Ever in 2026
I’ve been tracking both companies since BYD was dismissed as a Chinese budget brand with no Western relevance. That assessment aged badly. BYD surpassed Tesla in total EV volume in April 2025 in Europe — a market Tesla once owned. As a result, the Tesla vs BYD question is no longer an academic debate between a Western tech company and a Chinese manufacturer. It’s a direct competition for global EV dominance, and the outcome will determine what cars the world drives for the next decade.
Tesla vs BYD 2026 — Who Is Actually Winning?
BYD leads on total vehicle sales (4.27M vs 1.79M in 2024), global production capacity (5.82M vs ~2.5M), and affordability — with models starting under $10,000 in China. Tesla leads on pure BEV volume (still within ~30,000 units of BYD’s BEV count), software maturity, autonomous driving development, and Supercharger network reliability (~98% uptime). Neither company is the outright winner in 2026 — the result depends entirely on which metric you prioritize.
Sales Comparison: The Numbers Behind the Headlines
The headline “BYD outsells Tesla 2-to-1” is technically accurate — and profoundly misleading at the same time. Understanding why requires one critical distinction that almost every comparison article glosses over.
BEV vs. Total Sales: Why the Comparison Requires Context
Tesla sells only BEVs — every vehicle it makes is fully electric. BYD, by contrast, sells both BEVs and PHEVs (plug-in hybrids). In 2024, approximately 2.49 million of BYD’s 4.27 million vehicles were PHEVs. As a result, in pure BEV-to-BEV terms, Tesla’s 1.79 million versus BYD’s ~1.76 million BEVs makes the race essentially tied. That context doesn’t diminish BYD’s achievement — PHEVs are still electrified vehicles and still represent BYD’s engineering capability. However, it completely changes the narrative from “BYD is lapping Tesla” to “two companies running neck and neck in pure EVs while BYD operates in a second lane Tesla doesn’t enter.”
Growth Trajectory: The Number That Actually Decides the Future
Where BYD’s advantage becomes undeniable is growth rate. Tesla’s 2024 sales declined 1.1% year-over-year — the first decline in the company’s history as a public automaker. BYD, by contrast, grew 41.3% in the same period. Specifically, that growth rate, sustained over two to three more years, would give BYD an insurmountable BEV volume lead even without PHEVs. Tesla is aware of this. The company’s response focuses on the Refreshed Model Y, the Cybercab robotaxi program, and AI-driven autonomous driving commercialization — none of which are volume plays in the near term. That said, Tesla’s revenue of $97.7 billion versus BYD’s $85.7 billion confirms that Tesla still commands significantly higher revenue-per-vehicle — a profitability moat that gives it financial flexibility BYD hasn’t yet matched.
← Scroll to see full table on mobile
| Metric (2024) | Tesla | BYD | Winner |
|---|---|---|---|
| Total vehicle sales | ~1.79M | 4.27M | BYD |
| BEV-only sales | ~1.79M | ~1.76M | Tesla BARELY |
| PHEV sales | 0 | ~2.49M | BYD |
| YoY growth | −1.1% | +41.3% | BYD |
| Revenue | ~$97.7B | ~$85.7B | Tesla HIGHER |
| Production capacity | ~2.5M/yr | ~5.82M/yr | BYD |
Battery Technology: BYD Blade vs Tesla 4680
Battery technology is where the philosophical difference between these two companies becomes most clear. Tesla optimizes for energy density and performance. BYD optimizes for safety, cost, and longevity. Both approaches are correct — for different buyers.
BYD Blade Battery: Safety and Cost Above All
BYD’s Blade Battery uses LFP (lithium iron phosphate) chemistry — no cobalt, no nickel. That matters for three reasons: cost (LFP cells are significantly cheaper to produce than NMC), safety (the Blade battery passes the nail penetration test without fire or explosion), and longevity (LFP chemistry degrades approximately 30% more slowly than NMC over equivalent charge cycles). Specifically, Recurrent Auto’s fleet data shows BYD LFP models averaging battery degradation below 2% annually — among the lowest in any EV segment. BYD’s new 1000V platform builds on this with ultra-fast charging potential that the standard Blade architecture couldn’t support. The honest limitation: LFP energy density is lower than NMC, which is why BYD’s range figures tend to run shorter per kilogram of battery weight.
Tesla 4680 Cells: Engineering Innovation at Scale
Tesla’s 4680 cells represent a fundamentally different engineering philosophy. The larger cell format enables structural battery pack integration — the cells literally become part of the vehicle’s floor structure, reducing weight and manufacturing complexity simultaneously. Energy density per unit volume is higher than BYD’s LFP cells, which is why Tesla models consistently deliver longer EPA range at equivalent battery pack sizes. However, 4680 manufacturing scaling has been slower than Tesla projected — production ramp challenges at Gigafactory Texas have been publicly acknowledged. As a result, Tesla still runs a mixed cell strategy: 4680 cells in Model Y (Texas production), LFP cells in Standard Range variants, and 2170 cells in other configurations. That mixed approach gives Tesla flexibility but complicates the consumer messaging around battery technology.
Pricing: Where the Gap Becomes Impossible to Ignore
Every article on this topic mentions the price gap between Tesla and BYD. Most of them dramatically understate it. When you include BYD’s China-market pricing — the real floor of what’s achievable with vertical integration — the comparison becomes almost surreal.
China Market Pricing vs. Global Equivalents
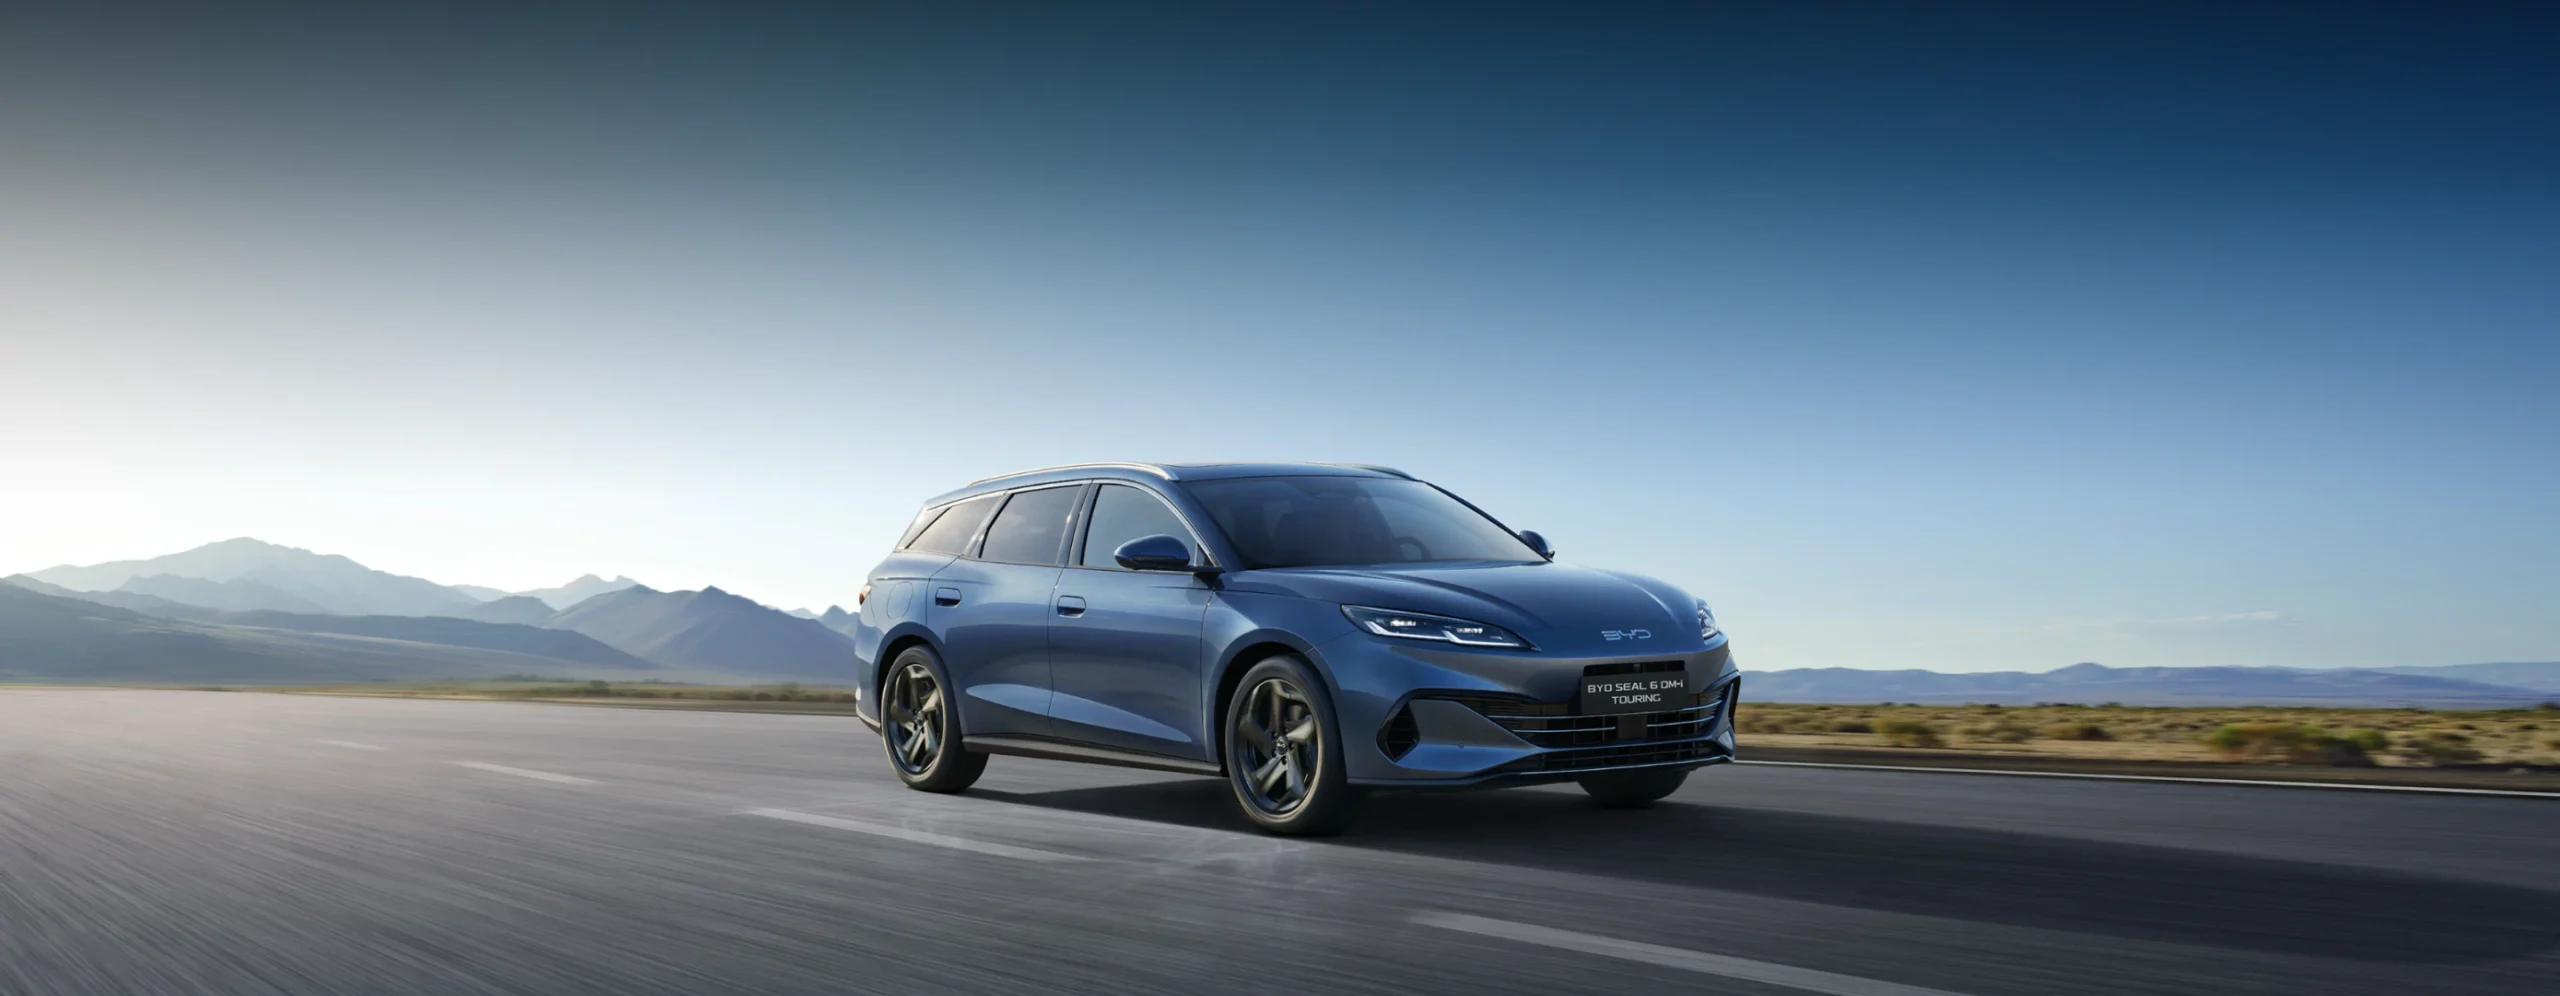
In China, BYD sells the Seagull from approximately $7,800. The Dolphin from approximately $13,500. The Seal — a genuinely competitive mid-size EV sedan — from approximately $24,000. These prices reflect BYD’s approximately 75% vertical integration rate, meaning BYD manufactures most of its own chips, batteries, motors, and structural components in-house. Tesla, by contrast, relies on a more conventional supplier network for many components, which makes its cost structure fundamentally different. As a result, Tesla’s cheapest model — the Model 3 Standard Range — starts at approximately $43,000 in the U.S., versus BYD’s global-market Dolphin at approximately $31,000 in markets where it’s sold. That $12,000 gap is not a matter of features — it’s a reflection of BYD’s manufacturing cost structure advantage.
The Honest Tradeoff on Price
Admittedly, price comparisons between BYD and Tesla need market context. BYD does not currently sell passenger cars in the United States due to 100%+ import tariffs introduced under recent trade policy — so the price gap is not directly relevant to American buyers. However, for buyers in Australia, UK, EU, and MENA markets, BYD’s pricing is both available and genuinely competitive. In Australia specifically, the BYD Seal undercuts the Tesla Model 3 by approximately AUD $10,000–$12,000 at comparable trims. That gap is large enough to be a decisive factor for most buyers who compare the two cars on a test drive.
← Scroll to see full table on mobile
| Model | China Price | Global Estimate | Tesla Equivalent | Price Gap |
|---|---|---|---|---|
| BYD Seagull | ~$7,800 | ~$21,000 | No equivalent | Tesla has nothing here |
| BYD Dolphin | ~$13,500 | ~$31,000 | Model 3 ($43K+) | ~$12,000 cheaper BYD |
| BYD Seal | ~$24,000 | ~$45,000 | Model 3 RWD | ~$0–$5K (market dep.) |
| Tesla Model Y | ~$28,000 | ~$45,000 | BYD Seal U / Atto 3 | Tesla premium ~$5–10K TESLA HIGHER |
Global Reach: Where Each Brand Actually Dominates
Geography defines this rivalry more than any technology comparison. Tesla and BYD are not competing in the same markets — which is why global sales figures are simultaneously informative and incomplete.
Tesla’s Geographic Strongholds
Tesla commands approximately 55% of the U.S. EV market — a dominance that is largely structural. Supercharger network density, Full Self-Driving access, and the lack of Chinese EV competition due to tariffs all protect Tesla’s U.S. position in ways that have nothing to do with product quality. In Scandinavia and parts of Northern Europe, Tesla similarly holds strong positions built on early mover advantage, Supercharger coverage, and brand loyalty from initial adopters. However, European market share has been eroding — BYD surpassed Tesla in monthly European EV registrations in April 2025, which is specifically the data point that changed how seriously European automakers view the Chinese competition.
BYD’s Geographic Expansion Strategy
BYD dominates China with approximately 34% of the NEV market — a market that represents the world’s largest EV volume by a substantial margin. In Southeast Asia, Latin America, and MENA, BYD is expanding aggressively with local manufacturing partnerships that reduce import costs and tariff exposure. Factories are either operating or under construction in Thailand, Hungary, Brazil, Turkey, and Indonesia. By contrast, BYD currently sells zero passenger cars in the United States — a deliberate consequence of U.S. trade policy rather than any product limitation. That absence makes U.S. comparisons between Tesla and BYD theoretical rather than practical for American buyers.
Software and Autonomous Driving: Tesla’s Most Durable Advantage
This is where Tesla’s lead is clearest — and most misunderstood. Most comparisons present software as a feature. It’s actually an infrastructure advantage that took years to build and cannot be replicated quickly.
Tesla FSD vs BYD God’s Eye
Tesla’s Full Self-Driving system operates on a vision-only architecture with no radar or LiDAR — a bold engineering choice that has been simultaneously criticized and validated by the data. FSD has accumulated billions of real-world miles of training data, creating a dataset that no other company can replicate on a comparable timeline. BYD’s “God’s Eye” ADAS system, launched in 2025, uses a more conventional approach combining cameras, radar, and Nvidia/Qualcomm chips. It’s genuinely capable for highway and urban assistance. However, it is approximately 3–5 years behind Tesla in real-world autonomy data accumulation — a gap that is hard to close regardless of hardware investment. That said, BYD’s God’s Eye advantage is that it targets a broader price range — the system is available across BYD’s lineup at lower price points than Tesla’s FSD subscription model.
OTA Updates and Software Ecosystem
Tesla’s over-the-air update system remains the benchmark for the automotive industry. Functionality genuinely improves post-purchase — range estimates, charging behavior, ADAS calibration, and infotainment all update without a dealer visit. BYD has invested significantly in OTA capability since 2023, and its 2025–26 model year vehicles show meaningfully improved update cadence compared to earlier production runs. However, the breadth and quality of Tesla’s software ecosystem — including energy management, route planning, Supercharger integration, and FSD improvements — remains ahead of BYD’s equivalent capabilities for owners who use those features actively.
Production Scale and Factory Strategy: Two Different Models
I’ve watched hundreds of EV buyers assume that more factories automatically means better value. That’s not how Tesla thinks — and the financial results suggest Tesla’s instinct is right for its current position.
BYD: Scale First, Everywhere
BYD’s manufacturing strategy is aggressive and global. Annual production capacity of approximately 5.82 million vehicles across 8+ global factories represents the most expansive manufacturing footprint of any EV company in history. New factories in Thailand, Hungary, Brazil, Turkey, and Indonesia are either operational or in late construction as of early 2026. Specifically, the Hungary plant is BYD’s first European manufacturing facility — it reduces the tariff exposure that has complicated BYD’s EU sales growth. BYD’s approximately 75% vertical integration rate means it manufactures its own batteries, chips, motors, and structural components, giving it cost control that no Western automaker can match at scale.
Tesla: Efficiency Over Expansion
Tesla’s manufacturing strategy is deliberately more conservative — four Gigafactories (Fremont, Shanghai, Berlin, Texas) with an emphasis on manufacturing efficiency per vehicle rather than raw capacity expansion. The Cybercab robotaxi represents Tesla’s next major production investment, targeting a manufacturing cost below $30,000 per unit. Tesla’s gross margin per vehicle remains significantly higher than BYD’s, which is why Tesla can sustain R&D investment in FSD, robotics, and AI at levels BYD hasn’t yet matched. The honest tradeoff: Tesla cannot scale fast enough to match BYD’s growth trajectory if BYD’s quality and software continue to improve at their current pace. However, if Tesla’s Cybercab and FSD commercialization succeed, the revenue model changes entirely — from vehicle sales to autonomous mobility services.
Who Should Buy Tesla vs BYD? The Buyer Decision Framework
Global market analysis is useful context. But you’re reading this because you’re considering a purchase, not an investment thesis. Here’s the honest, market-specific breakdown.
Choose Tesla If You Prioritize Technology and Ecosystem
Tesla wins for buyers who actively use and value FSD or advanced ADAS, want the highest Supercharger network reliability (~98% uptime versus ~80% for third-party networks), and want over-the-air software improvements that genuinely change the vehicle’s capability post-purchase. Tesla’s resale retention — specifically the Model Y at approximately 58% 5-year retention — also makes it the stronger choice for buyers who plan to trade in within 4 years. Specifically, in U.S., Canadian, and Norwegian markets, Tesla is also the only practical choice in this comparison since BYD doesn’t sell passenger cars there.
Choose BYD If You Prioritize Value and Battery Longevity
BYD wins for buyers in markets where it competes at retail — Australia, UK, EU, and MENA. The price gap versus Tesla at equivalent trim is approximately $8,000–$12,000 in these markets, which is a real and significant saving. The Blade LFP battery’s longevity profile — approximately 1.8% annual degradation based on Recurrent Auto data — is among the best in the segment and specifically suited to high-mileage commuters who want 10+ year ownership without battery replacement risk. BYD’s God’s Eye ADAS is genuinely capable for most driving scenarios. The honest gap is in software depth and Supercharger network access — buyers who do frequent long-distance road trips on routes without reliable public charging will have a better experience in a Tesla.
⚡ Choose Tesla If…
- You’re in the U.S., Canada, or Scandinavia (BYD not available)
- FSD / advanced autonomy is a priority
- Supercharger network reliability matters for road trips
- Resale value in 3–4 years is a financial priority
- You want post-purchase software that genuinely improves
🔋 Choose BYD If…
- You’re in AU, UK, EU, or MENA (BYD competes at retail)
- The $8K–$12K price gap is your primary decision driver
- 10+ year ownership with LFP battery longevity matters
- High daily mileage makes LFP degradation advantage meaningful
- You don’t rely heavily on long-distance public fast charging
FAQ: Tesla vs BYD in 2026
Is BYD bigger than Tesla in 2026?
By total vehicle sales, yes — BYD sold 4.27 million vehicles in 2024 versus Tesla’s 1.79 million. However, that comparison includes approximately 2.49 million BYD PHEVs. In pure BEV-to-BEV comparison, Tesla’s 1.79 million versus BYD’s ~1.76 million BEVs is essentially tied. BYD leads on production capacity (5.82M/year versus ~2.5M for Tesla) and growth rate (+41.3% versus −1.1% in 2024). By these measures, BYD is winning the scale race — however Tesla still leads in BEV volume, revenue ($97.7B vs $85.7B), and profit margin per vehicle.
Which is cheaper — Tesla or BYD?
BYD is significantly cheaper in markets where both brands sell. In China, BYD models start from approximately $7,800 for the Seagull and $13,500 for the Dolphin — categories Tesla doesn’t compete in at all. In Australia and Europe, BYD undercuts Tesla by approximately $8,000–$12,000 at comparable trim levels. As a result, BYD’s cost advantage traces directly to its ~75% vertical integration rate, which lets it manufacture batteries, chips, and motors in-house at costs no Western supplier chain can match. This advantage does not apply in the U.S., where BYD doesn’t currently sell passenger vehicles due to import tariffs.
Does BYD sell cars in the United States?
No — BYD does not currently sell passenger EVs in the United States. Import tariffs of 100%+ on Chinese-made EVs make direct passenger car sales economically unviable at competitive price points. BYD does sell electric buses and commercial vehicles in the U.S. market, however. For U.S. buyers, the Tesla vs BYD comparison is therefore a global market analysis rather than a direct purchase decision. Policy changes could alter this picture in future years, but no confirmed BYD U.S. passenger car launch is on record as of March 2026.
Who has better EV technology — Tesla or BYD?
It depends on which technology you value. Tesla leads on software maturity, autonomous driving capability (billions of real-world FSD miles), Supercharger network reliability (~98% uptime), and energy density per cell. BYD leads on battery cost efficiency, LFP safety (nail penetration test without fire), long-term degradation rates (~1.8%/year based on Recurrent Auto data), and manufacturing vertical integration. Neither advantage is universal — a buyer prioritizing long-term battery longevity at lower cost benefits from BYD’s technology, while a buyer prioritizing software depth and charging infrastructure benefits from Tesla’s ecosystem.
The Bottom Line: Tesla vs BYD in 2026
The global EV race between Tesla and BYD is the most important competition in the automotive industry — and it will define what cars the world drives for the next 20 years. BYD is winning on scale, price, and growth trajectory. Tesla is winning on technology, software, and profitability per vehicle. Neither company has landed a decisive blow. The battleground that will determine the outcome is not the U.S. — BYD doesn’t sell there. It’s Europe and Australia, where both brands now compete directly, where the price gap is real, and where buyers are making decisions today that will establish which brand earns loyalty for the next decade. Wherever you sit in that market, understanding the real financial decision behind buying a Chinese EV in 2026 is the most useful next step before choosing a side.