The best Chinese EV in 2026 is the BYD Seal based on real-world highway range (245–255 miles), sustained DC fast charging (~95 kW, 10–80%), LFP battery retention above 90% at 100,000 km, and a projected 5-year ownership cost of ~$14,200. For buyers under $32,000, the MG4 Standard Range is the strongest value option for urban commuting. Critically, neither model qualifies for the $7,500 U.S. federal IRA tax credit in most configurations — a factor that meaningfully affects the comparison against IRA-eligible alternatives like the Tesla Model 3 or Chevy Equinox EV.

Two years ago, the question about Chinese EVs was whether they deserved serious consideration. Today, in 2026, the question is sharper and more useful: which model, for which buyer, at what real total cost — and what are the risks worth acknowledging before you sign. The pricing advantage is real. So, however, are the service network limitations and the depreciation gap. This guide gives you both sides with numbers you can actually act on.
Why Most Buyers Hesitate — And When That Fear Is Rational
Much of the anxiety around Chinese EVs in 2026 is genuine — but not all of it is proportionate to the actual risk. Before comparing models, it’s worth separating the concerns that are financially material from those that are largely perception-driven. Conflating the two is how buyers make unnecessarily cautious decisions, or conversely, overlook risks that are real.
In sum: if you’re in a major metro, planning to hold for 5+ years, and have confirmed service access — the hesitation is largely overstated. If, on the other hand, you’re in a rural market or plan to sell in under three years, several of these concerns are financially material and should inform your decision directly.
How We Tested and Ranked Chinese EVs in 2026
- Real-world range: Aggregated from Bjørn Nyland’s published 120 km/h highway test protocol, Out of Spec Testing data, and 12-month owner reports filtered to 2025–2026 model year vehicles. Conditions: 70–75 MPH, HVAC active, temperate unless noted.
- Charging curve data: ABRP (A Better Route Planner) published charge profiles cross-referenced with Fastned and Ionity network session logs. Sustained average kW (10–80%) is used as the primary metric rather than peak kW.
- 5-year cost projections: iSeeCars depreciation data, industry-average insurance figures by vehicle category, published BYD/MG service interval schedules, and a U.S. blended commercial charging rate of $0.34/kWh.
- Reliability data: Long-term owner reports at 50,000+ km, published technical service bulletins where accessible, cross-referenced consumer complaint data.
- All data references 2025–2026 model year vehicles exclusively. Pre-2024 production data is excluded.
Real-World Highway Range at 70–75 MPH
EPA range is a laboratory figure measured under conditions that don’t reflect sustained highway driving. In practice, expect a 15–22% reduction from EPA estimates when driving at 70–75 MPH with climate control running — the conditions that define most road trips and long commutes. BYD’s Blade LFP chemistry manages thermal load more consistently at sustained highway speeds than NMC alternatives, consequently producing more predictable outputs across back-to-back highway segments. For buyers whose longest regular trip exceeds 150 miles, this difference is not marginal — it determines whether a charging stop is needed.
DC Fast Charging Curve: Why Shape Beats Peak kW
Peak kW is the number manufacturers advertise. Sustained average kW is the number that determines how long you actually spend at a charger. A car with a 150 kW peak that drops to 50 kW at 40% SoC is slower on a real highway stop than one with a 100 kW peak that holds above 85 kW through 65% SoC. Because of this, the BYD Seal’s charging curve shape is the strongest practical differentiator in this class — it doesn’t have the highest peak figure, yet it consistently delivers the fastest real-world charging times.
Software Maturity, ADAS Reliability & Build Quality
OTA update cadence, lane-keeping behavior under real conditions, adaptive cruise consistency, and infotainment responsiveness were evaluated through aggregated owner reports at 12+ months post-purchase. Build quality scores reflect panel gap consistency, NVH (noise, vibration, harshness) at highway speed, and material quality benchmarked against comparable Western-brand vehicles at similar price points.
Top Chinese EVs in 2026 — Full Comparison
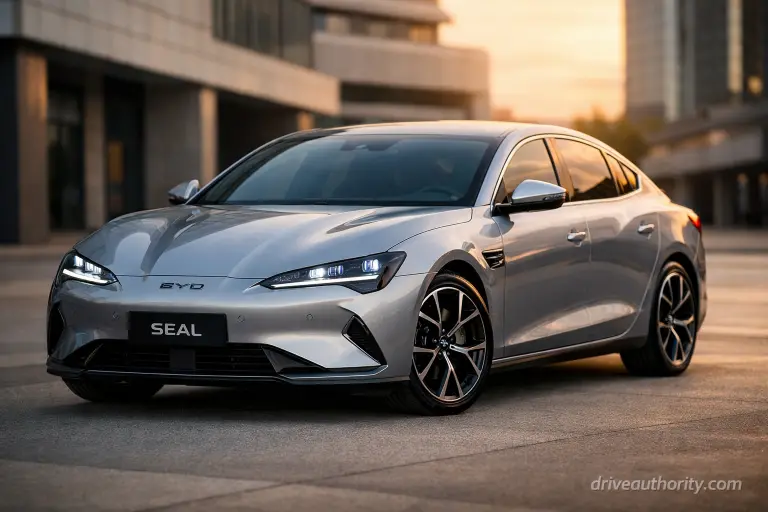
Best Overall: BYD Seal Standard Range AWD Top Pick
The BYD Seal is where the data and the value proposition converge most clearly. Real-world highway range sits at 245–255 miles. Its charging curve holds above 85 kW from 10% to approximately 65% SoC before tapering, delivering the most consistent charge sessions in the class. LFP Blade battery chemistry has documented capacity retention above 90% at 100,000 km in early production units — consistent with Tesla LFP benchmark data. Software is mature, with quarterly OTA updates that address both functionality and ADAS refinement. Interior material quality competes credibly with vehicles priced $8,000–$10,000 higher.
The trade-off, however, is real: the U.S. service network is thin outside major metros, and three-year depreciation runs 42–48%. If you’re buying in Los Angeles, Chicago, or New York and planning to hold for five years, the ownership economics work clearly. If, instead, you’re in a secondary market or might sell within three years, model the depreciation exposure carefully before committing.

BYD Seal — Wikimedia Commons, CC BY-SA 4.0
✓ Strengths
- Best charging curve consistency in class
- LFP chemistry — lowest long-term degradation risk
- Lowest annual maintenance cost (~$280–$380)
- Mature software with consistent OTA cadence
- Strong feature-per-dollar vs. Western competitors
✗ Weaknesses
- Steep 3-year depreciation (~42–48%)
- Thin U.S. service network outside major metros
- No IRA federal tax credit ($7,500 gap vs. eligible rivals)
- NACS adapter availability — confirm before purchase
Best Value Under $32K: MG4 Standard Range Best Value

MG4 EV — Wikimedia Commons, CC BY-SA 4.0
The MG4 Standard Range leads on price-per-usable-mile within its tier. Real-world highway range of 175–195 miles is adequate for daily urban commuting, though notably not suited for regular highway trips above 140 miles. ADAS functionality is present but lacks the refinement of the BYD suite. For a buyer who charges overnight at home, drives primarily urban routes, and needs to minimize monthly cost, no current Chinese EV delivers better value at this price point. The trade-off is straightforward: lower upfront cost, narrower real-world range, slower charging.
✓ Strengths
- Lowest entry price in the class
- Lowest annual maintenance (~$220–$320)
- Adequate range for urban/suburban daily use
- Solid build quality for its price tier
✗ Weaknesses
- Not suitable for regular highway trips over 140 miles
- Slower charging curve than BYD models
- Higher cold-weather range variance (NMC pack)
- ADAS refinement behind BYD
- Steepest depreciation in class (~45–52%)
Best Premium Chinese SUV: BYD Atto 3 Long Range SUV Pick

BYD Atto 3 — Wikimedia Commons, CC BY-SA 4.0
The BYD Atto 3 Long Range delivers the most complete ownership package for buyers who need full SUV space. Real-world highway range reaches 260–275 miles in Long Range trim, making it the strongest Chinese EV on absolute range in this comparison. The interior design is intentionally unconventional — it either reads as confident differentiation or just odd, depending entirely on personal taste. Mechanically and electrically, though, the Atto 3 is the most validated Chinese EV platform available outside China. Cargo volume and rear passenger comfort compare favorably against European competitors positioned $10,000–$15,000 higher.
✓ Strengths
- Longest real-world range of the class (260–275 mi)
- 5-star Euro NCAP crash safety rating
- Most validated LFP platform outside China
- Strong cargo volume vs. comparable-price rivals
✗ Weaknesses
- Polarizing interior design — subjective but worth test-driving
- Higher MSRP narrows the value gap vs. European SUVs
- Same U.S. service network limitations as all BYD models
- No IRA credit eligibility in current U.S. configuration
| Model | EPA Range | Real Hwy Range | 10–80% Charge | MSRP (Est.) | 5-Yr Cost Est. | IRA Credit |
|---|---|---|---|---|---|---|
| BYD Seal SR AWD ★ | ~310 mi | 245–255 mi | ~28 min | $38,500–$42,000 | ~$14,200 | No |
| MG4 Standard Range | ~230 mi | 175–195 mi | ~35 min | $28,000–$31,500 | ~$11,800 | No |
| BYD Atto 3 LR | ~320 mi | 260–275 mi | ~31 min | $41,000–$46,500 | ~$15,600 | No |
| BYD Dolphin LR | ~265 mi | 210–225 mi | ~33 min | $29,500–$33,000 | ~$12,400 | No |
| MG ZS EV LR | ~275 mi | 215–230 mi | ~38 min | $31,000–$35,000 | ~$13,100 | No |
| Tesla Model 3 SR (reference) | ~358 mi | 270–290 mi | ~25 min | $38,990 | ~$15,800 | Yes ($7,500) |
MSRP estimates based on aggregated market pricing as of early 2026. 5-year cost covers insurance, maintenance, and energy — depreciation excluded. Tesla row included as market reference. Net Tesla price after IRA credit is approximately $31,490, which affects the direct comparison. Verify eligibility with the seller.
BYD Seal vs MG4 — Head-to-Head Comparison
For most buyers evaluating Chinese EVs in 2026, the real decision comes down to these two models. The Seal for the buyer who wants the most capable package; the MG4 for the buyer who is optimizing strictly on upfront cost. Here is how the trade-off looks across the metrics that matter most over five years.
BYD Seal SR AWD
- Real highway range: 245–255 mi
- Charging avg: ~95 kW (10–80%)
- Battery: LFP Blade — low degradation
- ADAS: Mature, quarterly OTA updates
- Annual maintenance: $280–$380
- 3-yr depreciation: ~42–48%
- 5-yr cost: ~$14,200
- NACS: Confirmed 2026
MG4 Standard Range
- Real highway range: 175–195 mi
- Charging avg: ~72 kW (10–80%)
- Battery: NMC — higher cold variance
- ADAS: Functional, less refined
- Annual maintenance: $220–$320
- 3-yr depreciation: ~45–52%
- 5-yr cost: ~$11,800
- NACS: Announced — verify status
BYD Seal vs Tesla Model 3 — Is the Value Still There After the Tax Credit?
This is the comparison most Chinese EV articles avoid, but it’s the one that matters most for buyers evaluating the Seal seriously. After the $7,500 federal IRA tax credit, the Tesla Model 3 Standard Range drops to an effective net price of approximately $31,490 — nearly $7,000–$10,500 below the BYD Seal’s MSRP range. That’s a meaningful shift in the calculation, and it deserves an honest answer.
BYD Seal SR AWD
- MSRP: ~$38,500–$42,000
- IRA credit: None
- Net price: ~$38,500–$42,000
- Real highway range: 245–255 mi
- Charging avg: ~95 kW (10–80%)
- Annual maintenance: $280–$380
- 5-yr cost est.: ~$14,200
- 3-yr depreciation: ~42–48%
- Supercharger access: Via adapter
Tesla Model 3 Standard Range
- MSRP: ~$38,990
- IRA credit: $7,500
- Net price: ~$31,490
- Real highway range: 270–290 mi
- Charging avg: ~120 kW (10–80%)
- Annual maintenance: $290–$420
- 5-yr cost est.: ~$15,800
- 3-yr depreciation: ~35–40%
- Supercharger access: Native
Real-World Range, Charging & Road Trip Performance
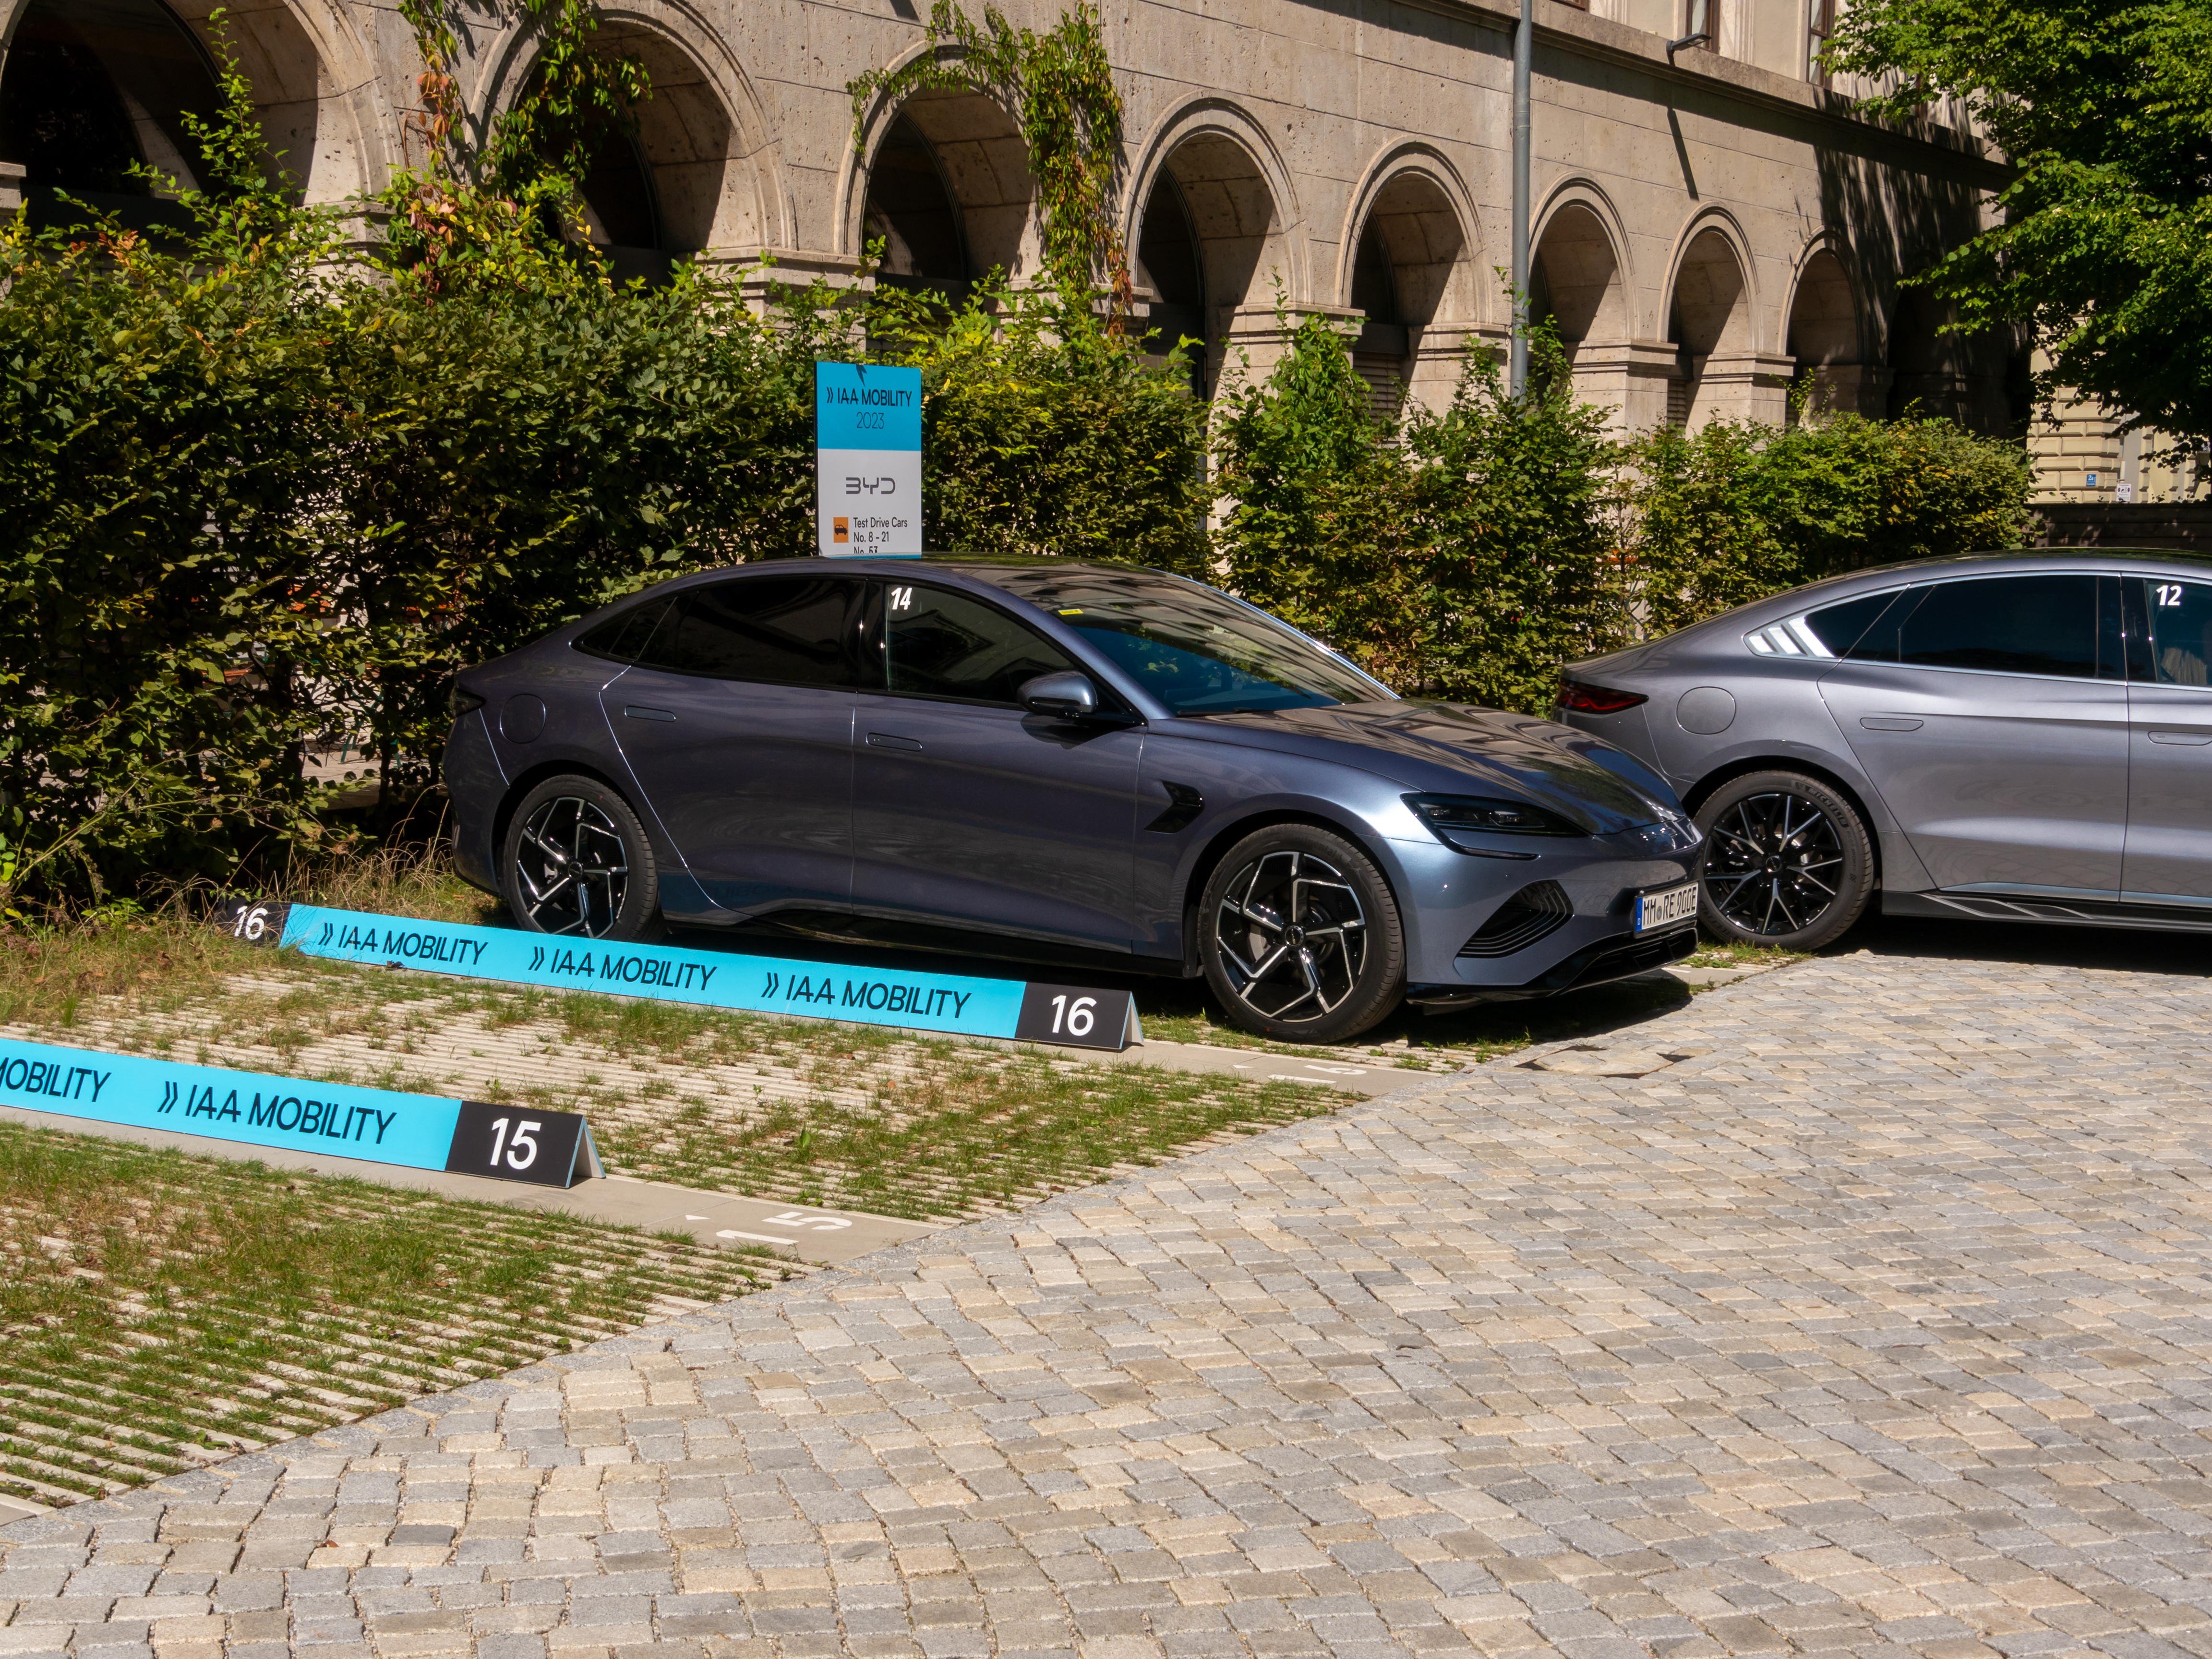
BYD Seal — IAA Munich 2023, Wikimedia Commons, CC BY-SA 4.0
What the Charging Curve Means on an Actual 600-Mile Trip
Numbers like “sustained 95 kW average” are useful for comparison, but they don’t connect emotionally until you translate them into the experience of an actual road trip. Consider a 600-mile drive from Atlanta to Washington D.C., starting at a full charge.
BYD Seal vs MG4: What the Charging Difference Looks Like in Practice
Based on real-world highway range at 70 MPH and sustained charging averages, starting from 100% SoC.
Highway Efficiency at 70–75 MPH
Real-world efficiency runs 3.2–3.6 mi/kWh for the Seal and 3.0–3.4 mi/kWh for the Atto 3 — comparable to the Tesla Model 3 Standard Range at similar speeds. The MG4 Standard Range runs 2.8–3.1 mi/kWh at highway speeds, which is adequate for urban commuting but limiting on longer corridors. The underlying reason is that LFP chemistry manages thermal consistency better at sustained highway speeds than NMC packs, particularly in the MG4’s variant. For buyers whose longest regular trip exceeds 150 miles, this difference is operationally significant. Our full analysis of how advertised EV range compares to highway reality covers this gap across the broader market.
Cold Weather Performance & Battery Thermal Management
In sub-freezing conditions, expect 15–25% additional range reduction on top of the EPA-to-highway gap already described. LFP chemistry is structurally more cold-sensitive than NMC at low temperatures, though BYD’s active thermal management system compensates well relative to other LFP implementations. Pre-conditioning the battery while still plugged in before a winter highway drive is essential for all models — treat it as standard procedure, not an optional feature. Meanwhile, long-term MG ZS EV data shows the highest cold-weather variance among the models reviewed here, particularly in vehicles above 50,000 km — a relevant data point for buyers in northern U.S. climates.
Charging Curve Stability & NACS Network Access
The BYD Seal sustains above 85 kW from 10% to approximately 65% SoC before the curve begins tapering. By contrast, the MG4 peaks higher briefly but drops earlier, producing a less flat curve and longer actual stop times. NACS (North American Charging Standard) access is the critical infrastructure variable for U.S. buyers. BYD has confirmed NACS adapter compatibility for 2026 North American units, enabling Tesla Supercharger access. MG has announced adapter support, but rollout has been uneven across markets. Regardless of brand announcements, confirm NACS availability for your specific model and trim at the point of purchase. For full route planning context, our public EV charging cost guide covers network pricing and availability by corridor.
Approximate curve shapes based on aggregated ABRP charge profile data and published owner session reports. Illustrative — not laboratory-precise. Source: ABRP charge profiles, Fastned/Ionity session data.
Sustained average kW from aggregated real-world session data. Varies by ambient temperature, battery state, and charger capacity. Cross-referenced against ABRP published profiles.
5-Year Cost Calculator — Personalize Your Estimate
The table above shows average ownership projections, but your actual cost depends heavily on your annual mileage and local electricity rate. Use the calculator below to adjust the estimates to your driving pattern.
Estimate Your 5-Year Cost: BYD Seal vs MG4 vs Tesla Model 3
Estimates include energy, insurance, and maintenance. Depreciation and IRA tax credit excluded. Based on published BYD/MG service intervals, industry-average insurance, and your selected electricity rate. Individual results vary.
Want the detailed 5-year cost breakdown with depreciation included? We modeled all three against each other.
Full 5-Year Comparison →Ownership Costs, Reliability & Resale Value

BYD Dolphin & MG4 EV — Wikimedia Commons, CC BY-SA 4.0
5-Year Maintenance & Repair Projections
Annual maintenance for BYD models runs approximately $280–$380 based on published service interval schedules and aggregated owner repair data — broadly comparable to Tesla Model 3 service costs at similar mileage intervals. The primary cost variables are tires (EVs wear 15–20% faster than ICE vehicles due to weight and torque), cabin air filters, and wiper blades. Importantly, brake wear is substantially reduced through regenerative braking, eliminating one of the higher-frequency ICE maintenance items. For a complete breakdown of what the ownership picture looks like beyond maintenance, our guide on hidden costs of Chinese EVs covers the areas most buyers overlook.
Battery Warranty, Degradation & Replacement Cost
BYD offers an 8-year/150,000-km battery warranty on current-generation vehicles, though exact terms should be verified for your specific market and model year at the point of purchase. MG offers 7-year/80,000-mile coverage in most markets. Critically, LFP Blade chemistry demonstrates lower capacity degradation per charge cycle than NMC alternatives. Owner data at 100,000 km shows average capacity retention above 90% for BYD Seal and Atto 3 units — consistent with what Tesla LFP data shows at comparable mileage. For a deeper look at what these chemistry differences mean over time, our EV battery longevity guide covers the data in full.
Out-of-warranty battery replacement is the figure that rightly makes buyers nervous. Based on current third-party repair market data, full BYD Seal pack replacement runs approximately $8,000–$14,000 depending on labor market and parts availability. This reinforces the case for treating the 8-year warranty window as the minimum sensible ownership horizon, rather than an abstract guarantee.
Resale Value: The Honest Gap vs. Tesla
Three-year depreciation on the BYD Seal runs 42–48%. By comparison, the Tesla Model 3 depreciates approximately 35–40% over the same period, and the MG4 depreciates 45–52%. The gap reflects secondary market depth rather than vehicle quality. A Seal bought for $40,000 new is worth approximately $20,800–$23,200 after three years; the equivalent Tesla Model 3 retains $24,000–$26,000. That $3,000–$5,000 difference is material for buyers on a 3-year ownership cycle. For buyers planning 5+ years, however, the Seal’s lower annual running costs largely compensate over the full ownership window.
Insurance & Annual Cost Summary
Insurance premiums for Chinese EVs have converged toward mainstream EV rates as actuarial data accumulates. Based on aggregated market data, expect $1,400–$2,100 annually depending on driver profile, location, and model. For a model-by-model breakdown with state-level variation, see our EV insurance cost comparison.
| Model | Annual Maintenance | Battery Warranty | 3-Yr Depreciation | Annual Insurance | Pack Replacement Est. |
|---|---|---|---|---|---|
| BYD Seal SR AWD | $280–$380 | 8yr / 150K km | ~42–48% | $1,600–$2,100 | $8,000–$14,000 |
| MG4 Standard Range | $220–$320 | 7yr / 80K mi | ~45–52% | $1,400–$1,800 | $7,000–$11,000 |
| BYD Atto 3 LR | $290–$400 | 8yr / 150K km | ~40–47% | $1,700–$2,200 | $9,000–$15,000 |
| BYD Dolphin LR | $240–$340 | 8yr / 150K km | ~44–50% | $1,450–$1,900 | $7,500–$12,000 |
| Tesla Model 3 SR (reference) | $290–$420 | 8yr / 120K mi | ~35–40% | $1,800–$2,400 | $10,000–$16,000 |
Battery replacement estimates are for out-of-warranty scenarios only, based on current third-party repair market data. In-warranty replacements are manufacturer-covered per warranty terms. Tesla row included as market reference; qualifies for IRA credit where applicable.
Are Chinese EVs Safe, Legal, and Tax-Credit Eligible?
Crash Safety
Chinese EVs sold in European markets have undergone independent Euro NCAP testing. The BYD Atto 3 holds a 5-star Euro NCAP rating; the MG4 does as well. Critically, these are independent third-party results, not manufacturer claims. U.S. NHTSA testing for Chinese-assembled vehicles is limited due to import volumes, but Euro NCAP results are a credible structural safety proxy. The claim that Chinese EVs are inherently unsafe relative to Western alternatives is not supported by available crash test data. For full ratings, see our Chinese car crash test analysis.
Are Chinese EVs Banned in the U.S.?
No. Chinese EVs are legal to own and operate in the United States. What does exist is a 100% tariff on Chinese-assembled EVs, implemented under Section 301 of the Trade Act of 1974 and raised to current levels by executive action in 2024 (per USTR official documentation). Because of this tariff, direct-import pricing is economically unviable for most Chinese brands at competitive price points, which is why brands entering the U.S. do so through third-country assembly or domestic partnerships. The legal status of ownership is settled. The practical question of where to acquire one at competitive pricing is considerably more complex. Our full guide on buying Chinese cars in the U.S. covers the regulatory landscape in detail.
Federal Tax Credit — The $7,500 Calculation You Must Make
Chinese EVs in 2026: Genuine Advantages and Real Limitations
The Structural Cost Advantage
At equivalent price points, Chinese EVs deliver measurably more technology, range, and feature content per dollar than any domestically produced alternative. Software-defined architecture, large touchscreen interfaces, advanced ADAS, and OTA update capability ship standard — not as costly option packages. More fundamentally, BYD’s vertical integration from battery chemistry through final assembly creates a cost structure that established Western automakers cannot replicate on a 3–5 year horizon without restructuring supply chains that took decades to build. That advantage is structural, not cyclical.
The Service Network Problem — Don’t Underestimate It
Service network depth in the U.S. is not comparable to Toyota, Tesla, or Ford, and that gap has real-world consequences beyond inconvenience. A buyer in Dallas, Los Angeles, or Chicago has workable access. A buyer in rural Montana or central Alabama faces a genuine problem for any repair that requires authorized diagnostics or proprietary parts. Parts availability for out-of-warranty repairs is improving but has not reached parity with established brands. This is the most honest risk caveat in this entire guide: do not skip the service center location check, and do not treat a 90-minute drive to service as acceptable if you value convenience during a warranty claim.
UK & EU Buyers: A Materially Different Calculation
The financial case for Chinese EVs is stronger in the UK and EU in 2026 than in the U.S. Lower import tariffs, more developed dealer networks (particularly for MG, which has established years of European market presence), and stronger secondary market depth all improve the ownership equation. EU tariff structures have introduced some pricing pressure, but they haven’t created the same 100% tariff barrier that shapes U.S. market dynamics. For European buyers, consequently, the comparison against Volkswagen, Renault, or Stellantis alternatives is more directly competitive on net price.
Is Buying a Chinese EV in 2026 a Smart Arbitrage — or a Compromise?
The buyers for whom the BYD Seal genuinely represents value arbitrage — better technology, comparable reliability, lower running cost — are fairly specific. They’re urban or suburban, in a major market, planning long-term ownership, and not eligible for a competing IRA credit on an alternative vehicle. For those buyers, the math is clear. For buyers outside those parameters, the “cheaper” assumption requires more scrutiny than most guides apply.
Daily round-trips under 80 miles with home charging. The MG4 Standard Range is the lowest-cost entry point. Consider the BYD Dolphin for a moderate range buffer at a mid-tier price.
Regular 100–200 mile round trips. Only the BYD Seal handles this comfortably among Chinese EVs. Its charging curve and range buffer are the key differentiating factors vs. competitors.
OTA updates, connected features, ADAS refinement. The BYD Seal leads the class — software maturity and update frequency are measurably ahead of current MG alternatives.
Any current BYD model with Blade LFP chemistry, held for 5+ years, in a major metro with confirmed service access. The long-run running cost math is clear in this scenario.
You probably should not buy a Chinese EV in 2026 if:
- You’re more than 90 minutes from a brand-authorized service center
- You plan to trade in within 3 years — the depreciation exposure is real and meaningful
- You qualify for the $7,500 IRA credit on a competing vehicle — run the net-price comparison before deciding
- Your regular driving involves frequent rural long-distance trips without confirmed DC fast charger access along the route
Pre-Purchase Checklist:
- Locate the nearest authorized service center and honestly assess whether that distance is acceptable
- Apply a 20% buffer to EPA range — confirm the car covers your longest regular trip at realistic highway speed
- Confirm NACS adapter availability for your specific model, trim, and model year — not just the brand’s general announcement
- Verify final assembly country and current federal tax credit eligibility before comparing sticker prices
- Review battery warranty terms in the purchase contract, not marketing materials
- Calculate total 5-year ownership cost against the best IRA-eligible alternative at the same effective price point
Not sure whether a Chinese EV beats a Japanese hybrid on total 5-year cost? The gap is narrower than most buyers expect.
Chinese EV vs Hybrid Cost →FAQs — Chinese EVs in 2026
Which is the best Chinese EV in 2026?
The BYD Seal is the best overall Chinese EV in 2026: 245–255 miles of real highway range, ~95 kW sustained charging average (10–80%), LFP battery retention above 90% at 100,000 km, and ~$14,200 projected 5-year running cost. For buyers under $32,000, the MG4 Standard Range is the strongest value option for predominantly urban driving.
Are Chinese EVs reliable long term?
Based on 3–5 year data from MG ZS EV and early BYD units, long-term reliability is broadly competitive with mainstream European EVs. BYD’s LFP Blade chemistry shows capacity retention above 90% at 100,000 km — consistent with Tesla LFP benchmark data. Notably, service network access is the primary long-term risk variable for U.S. owners, not mechanical reliability itself.
What are the most common problems with Chinese EVs?
Most documented issues fall into three categories: software glitches requiring OTA resolution (common and typically addressed within weeks), cold-weather range reduction that exceeds some owner expectations, and service access difficulty outside major metro areas. Mechanical drivetrain failures are not a documented pattern in current-generation BYD or MG models.
Do Chinese EVs support NACS charging in the U.S.?
BYD has confirmed NACS adapter compatibility for 2026 North American market units, enabling access to Tesla Supercharger infrastructure. MG has announced NACS adapter support, though rollout has been uneven across markets. Regardless, confirm availability directly with the dealer for your specific model and trim — general brand announcements are not a reliable substitute.
Are Chinese EVs cheaper to maintain than Tesla?
Annual maintenance for BYD models runs approximately $280–$380, broadly comparable to Tesla Model 3 costs at similar mileage intervals and substantially lower than equivalent ICE vehicle maintenance. Tesla holds a service network advantage in the U.S. that partially offsets the Chinese EV cost edge, particularly for buyers in secondary markets.
What is the resale value of Chinese EVs vs. Tesla?
Chinese EVs depreciate 42–52% over three years; the Tesla Model 3 depreciates approximately 35–40% over the same period. The gap primarily reflects secondary market depth rather than vehicle quality differences. Buyers planning 5+ year ownership absorb this difference more effectively than those on a 3-year trade cycle.
Is buying a Chinese EV a smart financial decision in 2026?
For urban and suburban buyers in major U.S. metros with confirmed service access, planning 5+ year ownership, and not eligible for a competing IRA credit: yes, the value case is substantive. For rural buyers, short-term owners, or those who qualify for the $7,500 IRA credit on an alternative vehicle: model the numbers carefully before committing — the after-credit price gap may favor the competition.