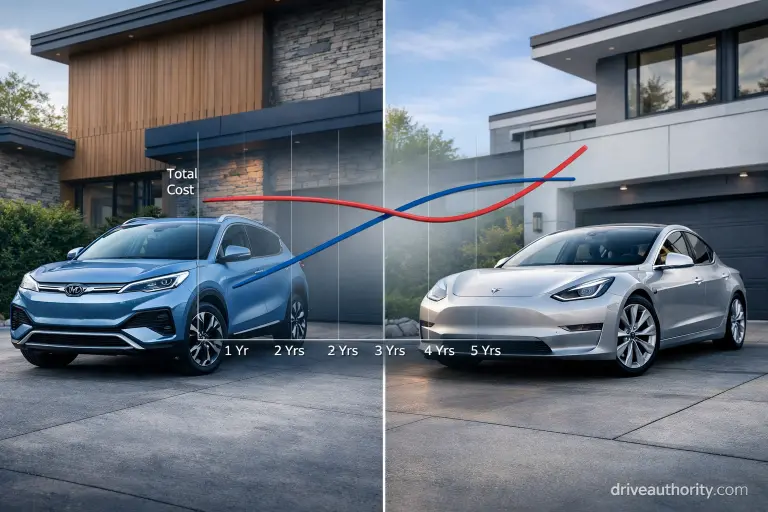
Chinese EVs cost $3,900–$6,800 less over three years than Tesla Model 3 or Y — but Tesla becomes cheaper at five years for most drivers. The advantage reverses around year four when depreciation curves cross and charging infrastructure effects compound. This isn’t about manufacturing quality or brand preference. It’s about matching depreciation trajectories, infrastructure dependencies, and exit timing to your actual ownership behavior.
Decision Summary: Cost Outcomes by Ownership Pattern
Chinese EVs win at 3 years (savings: $3,900–$6,800) when you:
- Charge at home 80%+ of the time, drive under 15,000 miles yearly, and exit before year four
- Prioritize lowest entry cost over resale value
- Live within 30 miles of authorized service infrastructure
Tesla wins at 5 years (savings: $1,200–$4,100) when you:
- Drive 18,000+ miles yearly, road trip monthly, or lack home charging access
- Hold vehicles past the 4-year depreciation inflection point
- Value charging network reliability over purchase price savings
Cost parity zone (difference under $1,500):
- 12,000–15,000 annual miles, 60/40 home/public charging, 4-year ownership horizon
Critical threshold: 3.8–4.2 years. Below this, lower purchase price dominates. Above it, slower depreciation and infrastructure advantages reverse total cost.
Cost Comparison: 3-Year Ownership (36,000 Miles)
| Cost Category | BYD Atto 3 | MG4 EV | Tesla Model 3 RWD |
|---|---|---|---|
| Purchase (post-incentive) | $34,000 | $32,500 | $40,500 |
| Energy (80% home) | $1,440 | $1,400 | $1,330 |
| Maintenance | $780 | $720 | $500 |
| Insurance | $4,470 | $4,410 | $4,860 |
| Depreciation | $14,760 | $15,275 | $12,150 |
| Total | $55,450 | $54,305 | $59,340 |
At 5 years (60,000 miles): Tesla drops to $71,200 while BYD rises to $74,800 — a $3,600 reversal driven by 12-point spread in residual values.
Who This Analysis Serves
This comparison addresses mid-market shoppers ($32k–$50k vehicles) evaluating 3–5 year ownership economics with realistic mixed-use driving patterns.
You’ll extract value if you’re:
- Comparing specific purchase decisions in the same price tier
- Modeling how charging access affects long-term costs
- Planning defined ownership timelines with clear exit strategies
Skip this if you:
- Drive under 8,000 miles yearly (cost spreads compress to insignificance)
- Need luxury specifications above $60,000 (different value equation)
- Operate in markets without Chinese EV service networks (hidden costs spike unpredictably)
Purchase Price vs Feature-Adjusted Reality
Advertised prices show BYD Atto 3 at $36,000, MG4 at $32,500, Tesla Model 3 RWD at $43,000 — an apparent $6,500–$10,500 gap.
Feature parity narrows this to $5,000–$9,000. Chinese EVs bundle heated/ventilated seats, 360° cameras, ambient lighting, and premium audio as standard. Tesla charges $300–$1,500 for equivalents or omits them entirely (no 360 camera option exists on Model 3).
Regional Incentive Impact
- US federal credits ($7,500) exclude most Chinese-manufactured vehicles due to battery sourcing rules
- State/local rebates sometimes favor lower sticker prices, benefiting Chinese EVs
- European structures remain more neutral
Effective price gaps vary 40–60% by postal code. California economics differ materially from Texas or Florida despite identical MSRPs.
Energy Efficiency vs Infrastructure Economics
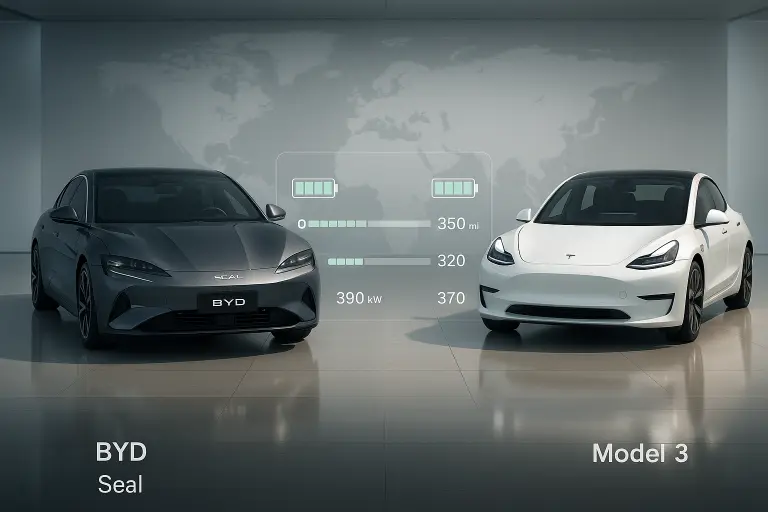
Efficiency spreads are narrow. Tesla Model 3 achieves 3.8 mi/kWh in real-world mixed driving (EPA methodology). BYD Atto 3 hits 3.5 mi/kWh, MG4 around 3.6 mi/kWh — a 7–9% Tesla advantage.
Home charging costs (12,000 miles yearly, $0.14/kWh):
- Tesla: $443/year
- BYD: $480/year
- MG4: $467/year
Three-year difference: $111–$120. Approximately 2% of total ownership cost.
Public Charging Inverts the Equation
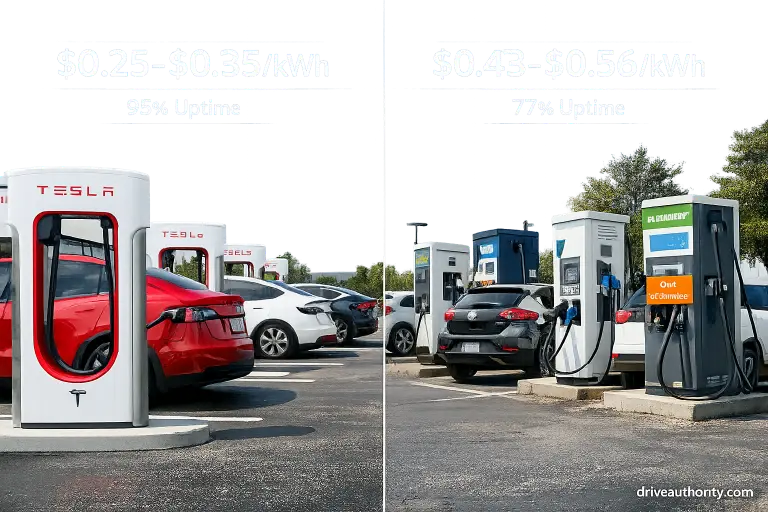
Tesla Superchargers: $0.25–$0.35/kWh
Third-party networks: $0.43–$0.56/kWh peak rates
At 50% public charging reliance (12,000 miles yearly):
- Tesla: $821/year
- BYD: $1,240/year
- MG4: $1,195/year
The gap expands to $374–$419 annually — $1,122–$1,257 over three years, eliminating most purchase price savings.
Efficiency percentages are noise. Infrastructure access is the signal for anyone charging publicly above 30% of sessions.
Charging Infrastructure as Hidden Cost
Tesla Superchargers maintain 95%+ functional uptime in established corridors. Third-party CCS networks average 77% reliability (J.D. Power 2024).
Time has quantifiable value. Six annual road trips losing 8 hours total to unreliable charging equals $200 yearly at $25/hour valuation — $600 over three years absent from traditional calculators.
NACS adapter rollout (2024–2025) narrows this gap but introduces $150–$250 hardware costs plus 2–5 minute software handshake delays. Infrastructure penalty is shrinking but remains material.
Service Network Density & Downtime Economics
Scheduled maintenance costs:
- Tesla: $380–$620 (3 years, mobile service available)
- Chinese EVs: $500–$850 (15–30% premium due to smaller dealer networks, parts markups)
Parts availability divergence: Chinese EVs average 3–6 week collision repair lead times versus 10–14 days for Tesla. At $45/day rental rates, a single moderate accident adds $450–$1,350 in costs invisible to standard comparisons.
Service penalty concentrates in:
- Rural/exurban areas (dealer 100+ miles away)
- Winter climates (higher accident frequency)
- Early-adoption markets (limited parts inventory)
Urban California/Texas/UK buyers face minimal friction. Others should budget $400–$800 additional three-year costs. For reliability context, Chinese vehicle dependability has reached parity with established brands — service infrastructure maturity lags behind product quality.
Insurance: Current Spread vs Future Convergence
Current annual premiums:
- Tesla Model 3: $1,620–$1,980
- Chinese EVs: $1,490–$1,740 (8–14% lower)
Three-year advantage: $390–$720 for Chinese EVs.
But repair cost data is reversing this. Insurers now see Chinese EV collision repairs running 12–22% higher than projections due to parts scarcity, unfamiliar body construction, and complex sensor recalibration.
Expect Chinese EV premiums to rise 5–10% relative to Tesla by 2026–2027 as actuarial models incorporate claim severity data. Current buyers capture favorable early pricing; future buyers subsidize the correction.
Depreciation: Where Long-Term Economics Diverge
3-year residual values:
- Tesla Model 3: 68–74% of original price
- Chinese EVs: 55–62%
On $36,000 BYD Atto 3:
- Resale: $19,800–$22,320
- Loss: $13,680–$16,200
On $43,000 Tesla Model 3:
- Resale: $29,240–$31,820
- Loss: $11,180–$13,760
Tesla advantage: $1,500–$2,500 over three years, recovering 25–40% of initial price gap.
Five-Year Curves Cross Decisively
5-year residuals:
- Tesla: 58–64%
- Chinese EVs: 42–49%
Value loss spreads:
- BYD: $18,360–$20,880
- Tesla: $15,480–$18,060
Gap widens to $2,880–$2,820, sufficient to reverse total cost equations despite higher entry price.
Why Tesla depreciates slower:
- Transferable Supercharger access reduces next owner’s operating costs
- OTA updates extend feature relevance (2019 models gained 2024 functionality)
- Deeper degradation data builds battery confidence
- Higher used-market liquidity enables faster sales, less negotiation pressure
Chinese EVs face skepticism about parts availability, service stability, and battery health despite comparable warranties. Used buyers discount for perceived risk even when reliability data shows equivalence. BYD versus Tesla comparison examines brand-specific approaches to long-term value retention.
When Lower Entry Cost Wins: 3-Year Ownership Profile
Chinese EVs deliver $3,900–$6,800 savings when:
- 12,000–15,000 annual miles, 80%+ home charging
- Under 4 road trips yearly exceeding 200 miles
- 3–4 year maximum ownership
- Authorized service within 30 miles
Example: Los Angeles buyer, 13,000 miles/year, home Level 2 charger, 3-year trade cycle.
BYD total: $55,450 | Tesla total: $59,340 | Advantage: $3,890
This describes 40–45% of EV buyers in California, Texas metros, major UK/European cities with mature dealer networks. Longest-range Chinese EVs now compete directly on single-charge capability while maintaining cost advantages.
When Slower Depreciation Wins: 5-Year Ownership Profile
Tesla delivers $1,200–$4,100 savings when:
- 18,000+ annual miles with frequent highway travel
- Public DC charging exceeding 40% of sessions
- 5+ year ownership intention
- Any geography (Supercharger density eliminates regional variation)
Example: Denver buyer, 19,000 miles/year, apartment (no home charging), monthly mountain trips, 6-year hold.
Tesla 5-year total: $71,200 | BYD total: $74,800 | Advantage: $3,600
This describes 30–35% of buyers — highway commuters, apartment dwellers in Supercharger metros, long-term owners prioritizing exit value.
Complete Cost Breakdown: 3-Year vs 5-Year
BYD Atto 3
3-Year (36k miles, 80% home):
Purchase: $34,000 | Energy: $1,440 | Maintenance: $780 | Insurance: $4,470 | Depreciation: $14,760
Total: $55,450
5-Year (60k miles, 80% home):
Purchase: $34,000 | Energy: $2,400 | Maintenance: $1,380 | Insurance: $7,450 | Depreciation: $19,520
Total: $64,750
Tesla Model 3 RWD
3-Year (36k miles, 80% home):
Purchase: $40,500 | Energy: $1,330 | Maintenance: $500 | Insurance: $4,860 | Depreciation: $12,150
Total: $59,340
5-Year (60k miles, 80% home):
Purchase: $40,500 | Energy: $2,215 | Maintenance: $920 | Insurance: $8,100 | Depreciation: $16,770
Total: $68,505
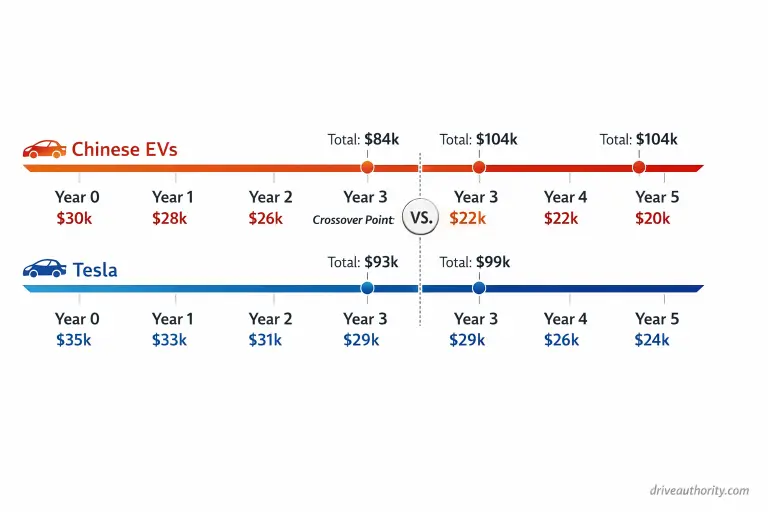
Key insight: $3,890 Chinese EV advantage at three years becomes $3,755 Tesla advantage at five years — a $7,645 swing attributable almost entirely to depreciation trajectory differences.
Crossover: 3.8–4.2 years depending on mileage and charging patterns.
Hidden Costs Standard Calculators Ignore
Software region locks: Some Chinese EVs disable voice control, navigation, ADAS features outside primary markets without clear disclosure.
NACS adapters: $150–$250 one-time cost for Supercharger access.
Warranty transfer restrictions: Chinese EV warranties often require dealer verification for second owners or exclude transfer entirely, reducing resale values 3–7% versus Tesla’s unconditional portability.
Parts lead times: 28-day average for Chinese EVs versus 12 days for Tesla on non-critical components. Daily drivers should budget rental costs during extended repairs.
Collision repair complexity: Unfamiliar body construction drives 15–25% higher labor estimates, occasionally pushing repairable vehicles into total loss.
Frequently Asked Questions
Are Chinese EVs cheaper to own long-term?
No beyond five years. They cost $3,900–$6,800 less over three years for home-charging commuters but Tesla becomes $1,200–$4,100 cheaper over five years due to slower depreciation and superior charging economics.
Why do Teslas hold value better?
Four compounding factors: transferable Supercharger access, OTA feature updates, extensive battery degradation data, higher used-market liquidity creating price stability.
Does charging access materially affect total cost?
Dramatically. Drivers without home charging save $600–$1,200 annually via Superchargers versus third-party networks — $3,000–$6,000 over five years, eliminating purchase price advantages entirely.
Which makes sense for apartment dwellers?
Tesla decisively. Without home charging, 60–80% public reliance delivers $900–$1,400 annual Supercharger savings, reversing cost equations within two years regardless of resale plans.
When does cost advantage flip?
Around 3.8–4.2 years. Below this, lower purchase price outweighs operating differences. Beyond it, Tesla’s compounding resale advantage and lower public charging costs dominate.
Do maintenance costs differ significantly?
Yes, 15–30% higher for Chinese EVs due to smaller dealer networks and parts markups. Expect $200–$350 higher three-year costs plus potential downtime expenses from longer collision repair lead times.
Decision Framework: Disposable Tool vs Compounding Asset
The cost comparison obscures a fundamental strategic choice.
Chinese EVs function as high-value consumables — purchase at $32k–$36k, utilize three years, exit at 60% residual, repeat. You’re optimizing cost-per-mile over fixed horizons with no platform loyalty, prioritizing lowest entry barrier.
Tesla functions as infrastructure investment — higher initial outlay purchases network effects (Supercharger access, software updates, resale liquidity) compounding annually. You’re paying for reduced long-term friction, with benefits materializing most clearly beyond year four.
Neither approach is superior. They serve different financial strategies.
The error is strategy mismatch — buying Chinese EVs intending six-year ownership (depreciation penalty destroys savings), or buying Tesla for three-year cycles (never capturing the long-term value you’re financing).
Best Chinese EV selection requires aligning total cost analysis with actual ownership intentions, not theoretical scenarios.
Calculate Your Outcome
Four variables determine your result:
- Ownership timeline: 3 years or 5+?
- Charging pattern: 80/20 home/public or 50/50?
- Annual mileage: Below 15,000 or above 18,000?
- Service proximity: Authorized dealer within 30 miles?
Input those parameters. The financially optimal choice emerges.
If 80% home charging, under 15,000 miles, 3-year exit — test BYD Atto 3 or MG4. Math favors by $4,000–$6,000.
If 50/50 charging, over 18,000 miles, 5+ year hold — test Tesla Model 3. Long-term structure favors by $2,000–$4,000 despite higher entry.
The decision is arithmetic matched to behavioral reality, not ideology.