U.S. Electric Vehicle Forecast: Key Numbers at a Glance (2026–2030)
| Metric | 2026 (Current) | 2030 (Projected) |
|---|---|---|
| EV new vehicle market share | 10–12% | 14–20% |
| Battery pack cost (per kWh) | ~$115–$130 | Below $80 |
| Public charging ports (U.S.) | ~220,000 | 500,000–1,000,000 |
| EVs on U.S. roads (total fleet) | ~5–6 million | 30–33 million (est.) |
| Average mid-range EV price (before incentives) | ~$42,000–$52,000 | ~$34,000–$44,000 |
| Federal EV tax credit (new vehicle) | $7,500 (current) | Uncertain — policy risk |
| Solid-state batteries (mass market) | Not yet available | Limited production only |
- EVs are projected to reach 14–20% of new U.S. car sales by 2030 under current policy trends — up from 10–12% today.
- Battery costs falling below $80/kWh will bring purchase price parity with gas vehicles closer without subsidies.
- NACS port standardization is eliminating plug compatibility friction for buyers across all major brands by 2027–2028.
- Home charging with time-of-use rates delivers energy costs of $0.03–$0.05 per mile — roughly 3× cheaper than gasoline.
- The $7,500 federal EV tax credit faces political uncertainty; buyers who qualify should not assume it survives unchanged through 2028.
- For high-mileage homeowners with incentive eligibility: buying now is financially sound. For apartment dwellers and low-mileage drivers: lease or wait.
Sources: U.S. Department of Energy, BloombergNEF EV Outlook, International Energy Agency, EPA regulatory filings, NREL. Projections reflect base-case policy scenarios. See methodology note below.
The future of electric vehicles in the U.S. is no longer a matter of speculation — it’s a structural market shift already measurable in sales data, infrastructure investment, and manufacturer lineup decisions. By 2030, the convergence of falling battery costs, a dramatically expanded charging network, maturing vehicle technology, and evolving federal policy will reshape every layer of the American auto industry. Furthermore, the window between 2026 and 2030 is not a passive waiting period — it’s a critical decision zone for buyers, fleet operators, and investors. Whether you’re timing a purchase, modeling total ownership costs, or simply trying to understand where the U.S. electric vehicle market is heading, the analysis below gives you the data and framework to plan with confidence.
Rather than sweeping optimism or reflexive skepticism, this guide takes a scenario-based approach: grounded in current data, calibrated to realistic policy trajectories, and structured around the specific decisions buyers actually face. Consequently, what follows covers EV adoption forecasts, charging infrastructure timelines, battery technology, pricing trends, total cost of ownership projections, and a direct answer to the question most buyers are asking — should you buy now or wait?
Jump to a Section
- EV Adoption Trends in the U.S. — Where the Market Stands in 2026
- Electric Vehicle Charging Infrastructure Expansion by 2030
- Battery Technology and Electric Vehicle Range Improvements
- EV Pricing Trends — Will Electric Cars Become Cheaper by 2030?
- U.S. Government Regulations and Policy Shifts Affecting EVs
- Impact on Gas Vehicles and the Used Car Market
- Grid Capacity, Energy Demand, and EV Sustainability
- Autonomous Driving and Software-Defined Electric Vehicles
- Total Cost of Ownership: 2026 EV vs 2030 EV Forecast
- Should You Buy an Electric Vehicle Now or Wait Until 2030?
- Risks and Uncertainties in the U.S. EV Market
- FAQs — Future of Electric Vehicles in the U.S.
- Final Outlook for U.S. Electric Vehicle Buyers
EV Adoption Trends in the U.S. — Where the Electric Vehicle Market Stands in 2026
In 2018, electric vehicles accounted for roughly 1% of new car sales in the United States. By 2024, that figure had climbed past 8%. As of early 2026, the future of electric vehicles in the U.S. is already visible in the sales data: EV market share sits between 10% and 12% of all new vehicle sales — meaningful progress, though a ceiling the industry is still working to break through decisively.
U.S. EV Market Share Growth (2018–2026) and 2030 Forecast
The trajectory is real, but it has not been linear. Growth accelerated sharply between 2021 and 2023, driven largely by Tesla’s volume dominance, record gasoline prices in 2022, and the original $7,500 federal tax credit. Since then, however, the pace has moderated. Inventory has built up at some dealerships, particularly for trucks and larger SUVs priced above $55,000. Moreover, the mass-market EV breakthrough — models under $35,000 with reliable range — has been slower to arrive than automakers promised.
| Year | EV New Vehicle Market Share | Key Driver |
|---|---|---|
| 2018 | ~1.0% | Tesla Model 3 launch |
| 2020 | ~2.0% | Expanded model lineup |
| 2022 | ~5.8% | High gas prices, IRA incentives |
| 2024 | ~8.1% | Broad price cuts, wider model range |
| 2026 (est.) | ~10–12% | NACS adoption, affordability push |
| 2028 (proj.) | ~13–17% | Sub-$30K models, improved grid reliability |
| 2030 (proj.) | ~14–20% | Price parity approaching, charging network maturity |
Regional Differences in U.S. Electric Vehicle Adoption
California remains the undisputed leader, accounting for roughly 35% of all U.S. EV sales despite representing about 12% of the national population. Similarly, the Pacific Northwest, Northeast corridor, and parts of Colorado show above-average adoption rates. The picture is very different in the Midwest and Southeast, where longer average commutes, lower fuel costs relative to coastal areas, limited public charging, and strong demand for trucks and large SUVs have kept electric vehicle uptake well below the national average. Any forecast that treats the U.S. EV market as a monolith will get the trajectory wrong.
Consumer Demand Drivers for Electric Vehicles
Among buyers who have already switched, the motivations are consistent: lower fuel costs, a reduced maintenance burden, strong performance characteristics — particularly instant torque — and environmental preference. Additionally, the federal and state incentive structure remains a significant purchase driver, with the point-of-sale credit introduced under the Inflation Reduction Act lowering the effective cost barrier considerably for buyers who qualify under income and vehicle price caps.
Persistent Barriers Slowing U.S. EV Adoption
The barriers are equally well-documented. Range anxiety remains a psychological friction point even as real-world range has improved substantially. Charging infrastructure reliability — not simply availability — continues to undermine confidence among prospective buyers. Upfront purchase prices still carry a premium over comparable gas vehicles in most segments, even after incentives. Furthermore, apartment or condo dwellers without access to home charging face a fundamentally different value proposition than homeowners with a dedicated garage.
If you live in the Pacific coast, Northeast, or a major metro area with strong charging infrastructure, the U.S. EV adoption curve is already working in your favor. If you are in the rural South or Midwest, electric vehicles are a genuine option today — but they require more upfront planning around charging access than coast-centric media coverage tends to suggest.
Electric Vehicle Charging Infrastructure Expansion by 2030
Charging infrastructure is the single variable that will most directly determine whether U.S. EV adoption reaches 20% of new sales by 2030 or stalls below 15%. The landscape is improving rapidly — but the experience remains uneven in ways that matter to buyers making long-term purchase commitments.
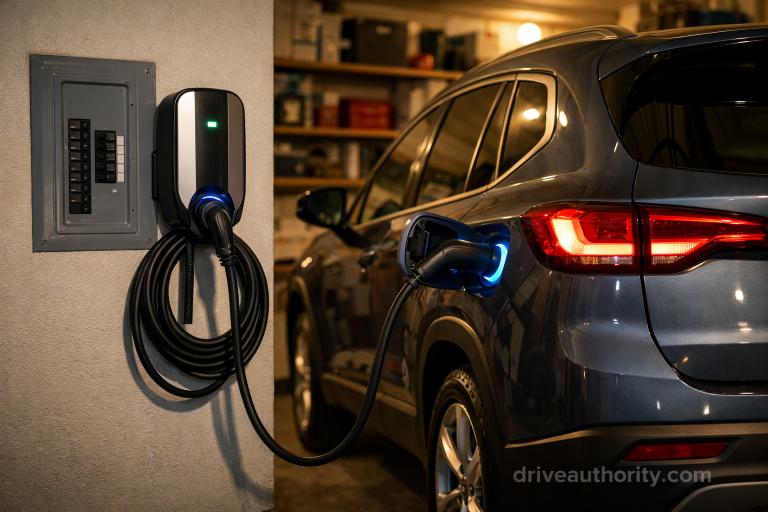
A Level 2 home charger installed in a residential garage — the primary and most cost-effective charging method for the majority of U.S. EV owners today.
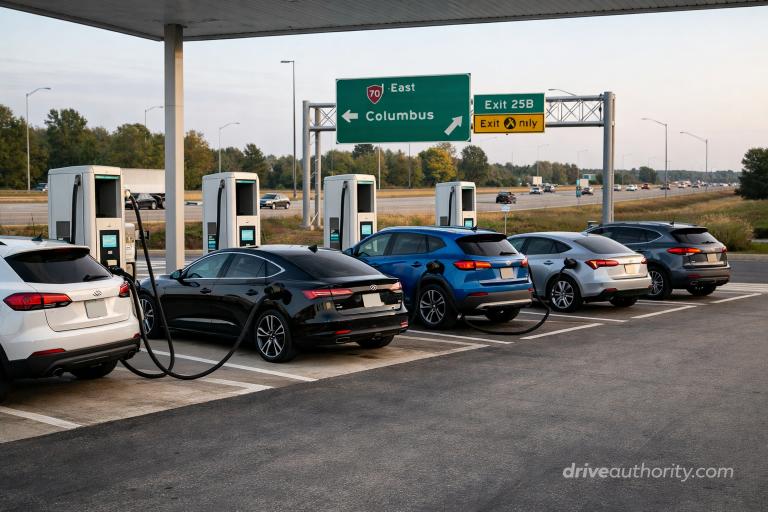
Public Fast-Charging Network: 2026 vs 2030 Projections
The U.S. had approximately 60,000 public EV charging locations as of late 2025, with around 180,000 individual ports. The NEVI program — funded at $5 billion through the Bipartisan Infrastructure Law — is adding DC fast chargers along interstate corridors with a mandate for chargers every 50 miles on designated highways. By 2030, projections from the Department of Energy and private analysts suggest the country could have between 500,000 and 1 million public charging ports. Importantly, however, the uptime reliability of that network matters as much as its raw scale.
| Metric | 2026 (Est.) | 2030 (Projected) |
|---|---|---|
| Public charging locations | ~70,000 | ~150,000–200,000 |
| Total public ports | ~220,000 | ~500,000–1,000,000 |
| DC fast charger ports | ~40,000 | ~100,000–200,000 |
| Avg. charger uptime rate | ~78% | Target: 90%+ |
NACS Standard Adoption and Charging Port Consolidation
One of the most consequential infrastructure developments of the past two years has been the industry-wide adoption of the North American Charging Standard (NACS), originally Tesla’s proprietary connector. Ford, GM, Rivian, Honda, Nissan, and virtually every major automaker have committed to transitioning to NACS, with most new models from 2025 onward shipping with NACS ports natively. As a result, by 2027–2028 the fragmented CCS/CHAdeMO landscape should be largely consolidated — finally removing one of the most persistent friction points for new EV buyers. Adapter confusion and network incompatibility have cost the industry consumer confidence for years; NACS unification ends that chapter.
Home EV Charging Trends and Smart Energy Integration
For most electric vehicle owners, home charging remains the primary and most cost-effective option. Level 2 home chargers (240V, typically 7–11 kW) can fully replenish most EVs overnight. The cost of setting up home EV charging has fallen as hardware prices drop and installation becomes more standardized, though electrical panel upgrades can still add $1,000–$3,000 in older homes. Beyond that, smart energy integration — chargers that communicate with home energy management systems and time-of-use electricity rates — can cut per-mile electricity costs by 30–50% in markets with variable rate pricing. Our guide to how long EV charging takes covers the full practical picture for new owners.
Rural Charging Gaps and U.S. Grid Readiness
The charging gap in rural America is not a minor inconvenience — it is a structural barrier to EV adoption that honest forecasting must account for. Long distances between charging stations, lower property values limiting home charging investment, and utility infrastructure requiring expensive upgrades all compound the challenge. NEVI funding prioritizes highway corridors, which helps long-distance travel, but it does not solve the last-mile rural access problem. Consequently, this will remain a meaningful adoption barrier through 2030 across significant portions of the country.
Urban and suburban homeowners can confidently plan around the current and near-term charging network. If you rent or live in a rural area, however, the infrastructure equation is still being resolved — factor this directly into your buy-vs-wait decision before committing. Our breakdown of public EV charging costs shows what relying on fast chargers means for your monthly budget.
Battery Technology and Electric Vehicle Range Improvements Through 2030
Battery technology is the beating heart of every EV market forecast, and it is also the area where hype most consistently outpaces reality. The good news is that incremental progress is steady and meaningful. The important caveat is that revolutionary developments — particularly solid-state batteries — are further from mass-market deployment than most headlines suggest.
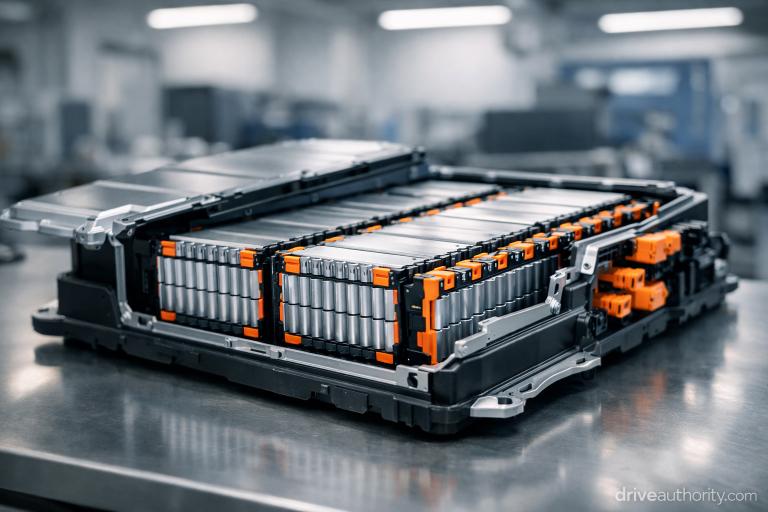
Modern EV battery pack modules. LFP chemistry now dominates the mainstream EV segment while solid-state development continues in parallel research programs.
Lithium-Iron Phosphate (LFP) Battery Adoption
LFP chemistry, long dominant in Chinese electric vehicles and now expanding rapidly in Western markets, has become the clear choice for standard-range and budget-segment EVs. LFP cells are cheaper to produce, carry longer cycle lives, tolerate full charges better than NMC chemistries without meaningful degradation, and eliminate the cobalt supply chain concerns that have dogged nickel-based batteries. Tesla’s standard range vehicles use LFP; so do many new entrants targeting the sub-$40,000 segment. Therefore, expect LFP to define the mainstream EV battery market through 2030 and beyond.
Solid-State Battery Development: Realistic Timeline for EVs
Solid-state batteries — which replace the liquid electrolyte in conventional lithium-ion cells with a solid material — promise higher energy density, faster charging, better thermal stability, and longer lifespan. Toyota, Samsung SDI, QuantumScape, and Solid Power are among the companies pursuing commercial production at scale. The realistic timeline, however, is this: limited production vehicles with solid-state cells may arrive by 2027–2028, but mass-market availability at competitive prices is a 2030–2032 story at the earliest. Consequently, waiting specifically for solid-state batteries before buying an electric vehicle is not a well-calibrated strategy for most buyers.
500-Mile Range Electric Vehicles: When to Expect Them
Average real-world EV range has climbed from roughly 195 miles in 2020 to over 270 miles across the market in 2025. Premium models already exceed 350–400 miles. By 2030, the center of gravity for mid-range electric vehicles will likely sit around 300–350 miles, with flagship models pushing 450+ miles. For most drivers, though, 300 miles is more than sufficient for daily use — improvements in fast-charging network reliability matter more than raw range numbers in practical terms. See our current round-up of the longest-range electric cars available today to understand where the ceiling currently sits.
EV Battery Recycling and Second-Life Applications
The battery recycling ecosystem is maturing rapidly, driven by regulatory pressure and genuine economic incentive — lithium, cobalt, and nickel recovery from used packs is increasingly cost-competitive. Second-life battery applications, specifically using retired EV packs for stationary grid storage, add a residual value layer that improves the overall economics of the ownership cycle. This has meaningful implications for depreciation modeling, particularly for early EV adopters holding 2020–2024 vehicles. For a deeper look at how batteries hold up over time, see our analysis of how long EV batteries actually last.
Don’t defer your purchase waiting for solid-state. Today’s LFP-based electric vehicles deliver reliable range, strong cycle life, and broad charging compatibility. The 2026–2027 EV cohort will age well. Solid-state will be a meaningful generational upgrade in the early 2030s — not a reason to postpone a financially sound decision today.
EV Pricing Trends — Will Electric Cars Become Cheaper by 2030?
The short answer is yes — but the trajectory is more nuanced than a simple decline curve. Battery cost reductions are real and continuing. Nevertheless, automakers are also targeting higher margins on electric vehicles as they scale production, which means not all cost savings will flow through to sticker prices. The more significant shift will be the expansion of the sub-$35,000 segment, which is currently underpopulated in the U.S. market and represents the biggest unmet demand opportunity.
Battery Cost per kWh: The Core Driver of EV Price Parity
Battery pack costs have fallen from over $1,100/kWh in 2010 to approximately $115–$130/kWh in 2025. BloombergNEF and other leading analysts project pack costs to fall below $80/kWh by 2030 — a threshold widely cited as the point at which electric vehicles achieve purchase price parity with comparable ICE vehicles without subsidies. The directional math is clear; however, the timing has consistently slipped by 1–2 years from earlier forecasts, so measured conservatism is warranted in any projection.
Mass-Market Electric Vehicles Under $30,000
The sub-$30,000 EV is the critical missing segment in the U.S. right now. The cheapest electric cars available in 2026 push the boundary but don’t yet consistently deliver on range, features, and reliability at that price point. By 2028–2030, however, a genuine cohort of 200–250 mile range electric vehicles priced under $28,000 before incentives is a reasonable expectation, driven by LFP cost improvements, manufacturing scale, and intensifying global competition. For current budget-focused options, see our picks for the best EVs under $40,000 in 2026.
Federal and State EV Incentives: 2026–2030 Outlook
The Inflation Reduction Act’s $7,500 new EV credit and $4,000 used EV credit have been meaningful demand drivers. Moreover, the point-of-sale structure introduced in 2024 dramatically improved accessibility for buyers who don’t owe enough in taxes to benefit from a nonrefundable credit. Whether the current incentive regime survives intact through 2030, though, depends heavily on Congressional politics — a genuine variable in any 5-year forecast that buyers should not plan around with certainty.
Used Electric Vehicle Market: Growing Opportunity and Hidden Risks
The used EV market is growing rapidly as the 2019–2022 vehicle cohort ages into the secondary market. Depreciation on early EVs has been steep — partly due to technology anxiety, and partly because range improvements in newer models make older units less competitive at similar prices. This creates real buying opportunities in the used segment, but it also raises legitimate questions about battery state-of-health verification and remaining warranty coverage. Our breakdown of monthly electric car ownership costs helps put the full picture in context.
| Segment | Avg. Price 2026 | Projected Avg. 2030 | Change |
|---|---|---|---|
| Entry-level EV (200–250 mi range) | $32,000–$38,000 | $24,000–$30,000 | ↓ ~20–25% |
| Mid-range EV (270–320 mi range) | $42,000–$52,000 | $34,000–$44,000 | ↓ ~15–20% |
| Premium EV (350+ mi range) | $58,000–$85,000 | $50,000–$72,000 | ↓ ~10–15% |
| Used EV (2–4 years old) | $18,000–$30,000 | $14,000–$25,000 | ↓ ~10–15% |
2030 electric vehicles will almost certainly be cheaper, longer-ranged, and more software-capable than today’s. However, today’s incentives may not exist in 2030. The real question is not whether EVs improve — they will — but whether the improvement justifies the cost of waiting, given currently available incentives and your specific ownership economics.
U.S. Government Regulations and Policy Shifts Affecting the Future of Electric Vehicles
Policy is simultaneously the most powerful accelerant and the greatest source of uncertainty in the U.S. electric vehicle market. The federal regulatory environment has shifted meaningfully under different administrations, and 2026–2030 will not be a period of policy stability — which makes scenario planning essential for any buyer or investor making long-term decisions.
Federal Emissions Targets and Their Impact on EV Growth
The EPA’s finalized emissions standards for light-duty vehicles, set in 2024, effectively require the equivalent of roughly 56 mpg fleet average by 2032 — a standard that practically mandates a substantial EV mix in automaker lineups. Regulatory rollbacks under shifting administrations can alter these targets, and the automotive industry has repeatedly lobbied for timeline extensions. In sum, the direction is toward electrification; the pace remains politically negotiable.
State-Level ICE Phase-Out Policies
California’s Advanced Clean Cars II rule requires 100% of new passenger vehicle sales to be zero-emission by 2035. Roughly 17 states have adopted California’s emissions standards, together representing approximately 40% of the U.S. new vehicle market. Even if federal policy retreats, the state-level regulatory floor for electrification remains substantial. Automakers cannot efficiently build entirely different lineups for California-aligned states versus the rest of the country — which means state-level policy punches well above its weight in driving industry-wide decisions.
EPA Standards, CAFE Rules, and EV Credit Trading
Corporate Average Fuel Economy standards operate in parallel with emissions rules, and the interaction between the two creates complex compliance calculations for automakers. Companies that exceed EV sales targets can generate regulatory credits that offset shortfalls in other vehicle segments. This credit trading dynamic means that even in a loosened regulatory environment, automakers retain strong financial incentives to continue electric vehicle development — not solely regulatory ones.
EV Incentive Phase-Out Scenarios for U.S. Buyers
| Scenario | New EV Credit | Used EV Credit | Market Impact |
|---|---|---|---|
| Incentives maintained (IRA intact) | $7,500 | $4,000 | Continued demand growth, faster price parity |
| Partial rollback | $3,750–$5,000 | $2,000 | Slower near-term growth, minimal long-term change |
| Full elimination | $0 | $0 | Demand dip 2027–2028, recovery as organic price declines accelerate |
Impact on Gas Vehicles, Hybrids, and the U.S. Used Car Market
The electric vehicle transition does not only affect EV buyers — it reshapes the economics of gas vehicle ownership in ways already beginning to show up in residual value data and auction forecasts across the country.
Resale Value Trends for ICE Vehicles Through 2030
Gasoline-powered vehicles in segments where EV alternatives are strong — compact cars, sedans, and small SUVs — are beginning to show softer residual values in forward-looking auction projections. The effect is gradual rather than sudden. Trucks and large SUVs with limited compelling electric alternatives remain relatively insulated for now. However, buyers planning to hold ICE vehicles through 2030 and sell into a market with 15–20% EV share should model depreciation more conservatively than historical norms suggest.
Depreciation of Early Electric Vehicle Models
Early EVs from 2019–2022 have depreciated faster than many owners anticipated, driven by the rapid technology advancement visible in newer models. A 2021 electric vehicle with 200-mile range competing against a 2026 model at the same price point — but with 280+ miles and native NACS charging — faces a difficult resale proposition. This depreciation curve should moderate as the technology matures, meaning 2025–2026 EVs should depreciate more similarly to ICE vehicles than their predecessors did. Our full breakdown of electric car vs gas car costs puts these long-term numbers in context.
Hybrid Vehicles as Transitional Technology
Hybrid and plug-in hybrid vehicles occupy an increasingly interesting market position. As pure EV adoption grows, conventional hybrids serve buyers who are not yet ready to commit to full electrification — particularly those without reliable home charging access. PHEV sales have grown steadily, and models like the Toyota RAV4 Prime continue to show strong residual values. Through 2030, hybrids will likely hold their value better than either early-generation EVs or aging ICE vehicles in most segments. If you are weighing all powertrain options, our EV vs Hybrid vs Plug-in Hybrid comparison offers a structured decision framework.
U.S. Grid Capacity, Energy Demand, and EV Sustainability
One of the most persistent objections to mass EV adoption is grid capacity. The concern is legitimate in its specifics but consistently overstated as a near-term national barrier when examined at the system level.
Can the U.S. Power Grid Actually Handle EV Growth?
Total electricity demand from electric vehicles, even at 30 million vehicles on U.S. roads by 2030, would represent roughly a 10–12% increase in national electricity consumption — significant, but well within the range that grid operators and utilities have modeled and planned for. The local grid stress problem, however, is more acute. Certain distribution circuits, particularly in regions with rapid EV adoption or dense fast-charging deployments, require infrastructure investment that can take years to execute. Smart charging — time-shifting demand away from peak hours — is the critical near-term management tool, and most modern electric vehicles and chargers support it natively.
Renewable Energy Integration with EV Charging
The carbon footprint of EV charging depends heavily on the energy mix of the regional grid. In states with high renewable penetration — California, Washington, Colorado — electric vehicles already operate with a substantially lower lifecycle carbon footprint than even the most efficient gas vehicles. In coal-heavy grid regions, the calculation is tighter, though still favorable over a vehicle’s full lifetime as the grid continues to decarbonize. By 2030, the average U.S. grid carbon intensity is projected to be meaningfully lower than today, strengthening the environmental case for EVs uniformly across all regions.
Vehicle-to-Grid (V2G) Technology: What Buyers Should Expect
Vehicle-to-grid technology — allowing electric vehicles to export stored energy back to the grid or home during peak demand periods — has moved from concept to limited commercial reality. The Ford F-150 Lightning and several other models already offer bidirectional charging capability. By 2030, V2G-compatible vehicles should be mainstream across most manufacturer lineups, and utilities in several markets are actively developing compensation programs for EV owners who participate in demand response programs. This effectively transforms the EV battery from a pure cost into a potential ongoing revenue asset — a meaningful shift in long-term ownership economics.
Autonomous Driving and Software-Defined Electric Vehicles by 2030
The EV and autonomous vehicle conversations have been conflated in public discourse, but they are distinct trajectories that will intersect significantly by 2030 in ways buyers should understand before committing to a purchase or lease decision.
Over-the-Air Updates and Software Monetization in EVs
Software-defined vehicles — where core vehicle functions, performance parameters, and features are delivered and updated via software rather than hardware — are already a reality on Tesla, Rivian, and GM’s latest platforms. Over-the-air updates can improve range, add features, fix bugs, and in some cases unlock hardware capabilities that were present from the factory but not initially active. This fundamentally changes the depreciation model: a 2025 electric vehicle receiving meaningful OTA improvements in 2027 holds its value differently than a comparable 2005 sedan simply aging. It also introduces a subscription revenue model that some automakers are aggressively pursuing, which buyers should factor explicitly into total cost of ownership projections.
Level 3–4 Autonomy: Realistic Deployment Timeline for Consumer EVs
Level 2 driver assistance (adaptive cruise, lane centering) is now widespread across the EV segment. Level 3 autonomy — where the vehicle handles driving in defined conditions without active human monitoring — is at limited commercial deployment in 2026. Level 4, full autonomy within geofenced areas, is operational in some robotaxi contexts. Nevertheless, widespread consumer-owned Level 3–4 vehicles remain a post-2030 story for most of the market, as regulatory, insurance, and liability frameworks are as far from resolution as the underlying technology itself.
Subscription-Based Features and Their Impact on EV Ownership Costs
The subscription model for vehicle features is one of the more contentious developments in the industry. Heated seats, enhanced driver assistance, battery capacity unlocks, and other capabilities locked behind monthly fees represent a new cost layer that simply did not exist in traditional vehicle ownership economics. Buyers evaluating long-term EV costs should read feature agreements carefully and model projected subscription costs for capabilities that matter to them. Not all automakers are pursuing aggressive subscription monetization — this is an area where brand choice carries real financial consequences over a 5-year ownership period.
Total Cost of Ownership: 2026 Electric Vehicle vs 2030 EV Forecast
The total cost of ownership argument for electric vehicles in the U.S. is compelling — but context-dependent. High-mileage drivers, homeowners with charging access, and buyers in high-gas-cost markets see the fastest payback periods. Lower-mileage drivers, apartment dwellers, and buyers in markets with cheap gas and expensive electricity need to calculate their specific situation carefully before assuming EVs are automatically cheaper. Our complete EV total cost of ownership guide provides a full modeling framework for your scenario.
5-Year Cost Comparison: 2026 EV vs 2030 EV vs 2026 ICE
| Category | 2026 EV (Mid-Range) | 2030 EV (Projected) | 2026 Comparable ICE |
|---|---|---|---|
| Purchase Price (before incentives) | $42,000 | $34,000 | $36,000 |
| 5-Year Fuel / Electricity | $5,500 | $5,000 | $14,000 |
| 5-Year Maintenance | $3,500 | $3,000 | $7,500 |
| Insurance (5-year) | $9,500 | $8,500 | $8,000 |
| Depreciation (5-year) | $18,000 | $14,000 | $16,000 |
| Est. 5-Year Total Cost | $78,500 | $64,500 | $81,500 |
Figures are illustrative estimates for a mid-range compact SUV segment. Actual costs vary significantly by location, driving pattern, electricity rates, and specific model. Insurance for electric vehicles is currently slightly elevated vs. comparable ICE vehicles in most markets — see our detailed EV insurance cost comparison for current data. Five-year cost methodology follows DOE and industry-standard consumer vehicle cost modeling frameworks.
EV Cost Per Mile Forecast: 2026 to 2030
On a pure energy cost basis, electric vehicles charged at home in most U.S. markets run at roughly $0.03–$0.05 per mile. Gasoline vehicles, by contrast, average $0.10–$0.14 per mile at current fuel prices. That gap is the core financial argument for EVs, and it persists across nearly all reasonable scenarios through 2030. The calculation shifts significantly, though, if a driver relies heavily on public fast charging — where per-kWh costs can rival or exceed the energy-equivalent cost of gasoline in some markets. Our full breakdown of public EV charging costs explains exactly what that means for real-world budgets.
High-Mileage vs Low-Mileage EV Owner Scenarios
A driver covering 18,000+ miles annually captures fuel and maintenance savings quickly. Typical payback periods against a comparable ICE vehicle run 3–4 years, even without incentives, in favorable markets. A driver covering 8,000 miles per year, however, sees those savings accumulate much more slowly — the higher upfront purchase price may not be fully offset within a typical 5–6 year ownership cycle. Annual mileage is therefore the single most important personal variable in the electric vehicle buy-now decision.
Urban vs Rural EV Ownership: How Location Shapes the Math
Urban owners with access to home or reliable workplace charging tend to see the strongest EV economics. Stop-and-go traffic favors regenerative braking efficiency, and shorter average trip distances fit comfortably within any modern electric vehicle’s range. Rural owners driving long distances on highways — often without convenient public charging access and sometimes on higher electricity tariff rates — face a genuinely different financial equation. The full breakdown of monthly car ownership costs in the U.S. illustrates exactly how much geography shapes these numbers.
By 2030, the projected 5-year total cost of a mid-range electric vehicle falls by approximately $14,000 compared to today’s equivalent — driven by purchase price declines, lower depreciation, and gradual insurance normalization. However, today’s EV is already cheaper to own over 5 years than a comparable ICE vehicle for most mid-to-high mileage drivers. The math works now if your situation fits the profile.
Should You Buy an Electric Vehicle Now or Wait Until 2030?
This is the question most prospective buyers of electric vehicles in the U.S. are actually asking, and it deserves a direct answer rather than hedged non-committal guidance. The decision depends on your specific circumstances more than any single market trend — but the framework below makes the logic concrete and actionable.
Buy Now: The Case for Purchasing an EV in 2026
✅ Buy Now If…
- You own a home with garage or dedicated charging access
- You drive 12,000+ miles per year
- You qualify for current federal and state EV incentives
- Your primary use case is daily commuting within 150 miles
- You are replacing an aging vehicle with mounting repair costs
- Gas prices in your area consistently exceed $3.50/gallon
- You want to lock in incentive structures that may be eliminated
⏳ Wait If…
- You lack reliable home charging and your area has poor public network coverage
- You drive low annual mileage (under 8,000 miles/year)
- Your current vehicle is reliable with low operating costs
- Your segment isn’t well-served by EVs today (e.g., heavy-duty towing)
- You’re specifically targeting sub-$28,000 models not yet in market
- Technology obsolescence risk is a significant concern for your financial situation
Leasing as a Strategic Bridge Option for EV Buyers
Leasing an electric vehicle in 2026 is a strategically sound move for buyers who want to participate in the EV transition without committing to ownership through a period of rapid technology change. A 3-year lease captures current incentives — the commercial vehicle credit pathway makes many leases eligible for the $7,500 credit regardless of vehicle price or buyer income caps — limits exposure to battery degradation risk, and positions you to step into a substantially improved 2029–2030 model at lease end. The trade-offs are no equity accumulation and potentially slightly higher total cost than financing a purchase. Nevertheless, for buyers prioritizing flexibility and technology currency, leasing is worth serious financial modeling before deciding.
Risk Tolerance and Technology Obsolescence in EV Ownership
Early adopter risk is real but diminishing rapidly. A 2026 electric vehicle is a far more mature product than a 2019 equivalent. NACS standardization, improved battery management systems, expanded warranty coverage, and a growing independent service network all reduce the specific technology obsolescence risks that burned some early adopters. The risk of buying a 2026 EV and finding it inadequate or poorly supported by 2031 is meaningfully lower than the equivalent risk in 2020. That said, buyers operating on tight household budgets should account for this variable carefully before committing. Our guide to first-time EV buyer mistakes covers the most common ways buyers underestimate these risks going in.
Risks and Uncertainties in the Future of Electric Vehicles in the U.S.
Any responsible 5-year forecast for the U.S. electric vehicle market must confront the substantial uncertainties that could disrupt even the most carefully modeled projections. These are not hypothetical concerns — they are active variables that buyers and investors should weight explicitly in their planning.
EV Supply Chain Volatility and Critical Mineral Risk
Lithium, cobalt, nickel, and manganese — the critical minerals in EV batteries — are geographically concentrated in ways that create real supply risk. The Democratic Republic of Congo supplies over 70% of global cobalt. Chile and Australia dominate lithium production. China controls a disproportionate share of battery cell processing capacity. Geopolitical disruption, trade policy shifts, or unexpected demand spikes can compress battery cost trajectories or create production bottlenecks that slow the electric vehicle affordability curve. Diversifying critical mineral supply chains is a multi-decade project, not a 5-year fix.
Policy Reversals and Their Impact on U.S. EV Growth
Federal incentive structures, emissions regulations, and infrastructure funding have all proven susceptible to administration changes. Buyers and investors pricing in specific policy continuity should scenario-plan explicitly for rollbacks. The industry’s baseline trajectory toward electrification is robust enough to survive a reversal of U.S. federal incentives — global demand, state-level policy, and organic battery economics provide a durable long-term foundation — but the near-term pace and affordability curve would be meaningfully affected.
Charging Reliability: The Ongoing Concern for EV Buyers
Uptime and reliability of public charging infrastructure remain legitimate concerns for prospective electric vehicle buyers. Surveys consistently show that EV drivers encounter non-functional chargers at a meaningful rate — estimates range from 20–25% of charge attempts encountering some issue, though experiences vary considerably by network operator and geography. The NEVI program includes a 97% uptime requirement as a condition of funding, which should drive structural improvement. Achieving and maintaining that standard across a rapidly expanding network, however, is genuinely difficult in practice.
Battery Raw Material Constraints and Price Volatility
Even with LFP chemistry reducing cobalt dependence, lithium demand is projected to grow faster than new production capacity through the late 2020s. Lithium prices are notoriously volatile — already cycling from extreme highs back to more moderate levels in recent years — and this introduces uncertainty into the cost projections that even well-resourced analysts have consistently struggled to model accurately over multi-year horizons.
FAQs — Future of Electric Vehicles in the U.S.
How many electric vehicles will be on U.S. roads by 2030?
Approximately 30–33 million electric vehicles are projected to be on U.S. roads by 2030, based on base-case estimates from the DOE, BloombergNEF, and IEA. This assumes partial incentive continuation and current regulatory momentum. That figure represents roughly 10–12% of the total U.S. vehicle fleet — though new vehicle sales share will be meaningfully higher, in the 14–20% range, due to the multi-year lag of existing ICE vehicles in circulation.
Will electric cars be cheaper than gas cars by 2030?
Purchase price parity without subsidies is projected to arrive in the early-to-mid 2030s for mainstream segments, with genuine sub-$30,000 EVs becoming competitive by 2028–2030. With current incentives, however, many new electric vehicle purchases are already economically competitive with gas vehicles on a 5-year total cost basis today. The sticker price premium will shrink substantially by 2030 but may not fully disappear in all segments without some form of incentive support.
Is U.S. EV charging infrastructure keeping up with electric vehicle growth?
In urban corridors and along major interstates, yes — the gap is closing steadily. In rural areas, smaller cities, and apartment-dense markets, public charging infrastructure remains inadequate for mass EV adoption. NEVI funding and private investment are accelerating expansion significantly. Equitable charging access across all U.S. geographies, however, is a 2030s achievement rather than a 2026–2028 one in most realistic scenarios.
Are solid-state batteries coming before 2030?
Limited production vehicles with solid-state cells may arrive by 2027–2028, but mass-market deployment at competitive prices is more realistically a 2030–2032 event. Waiting to buy an electric vehicle specifically for solid-state batteries is not a well-calibrated strategy for most buyers. The real-world performance gains over current best-in-class LFP chemistry — while genuine — won’t be as transformative in daily use as headlines suggest, and today’s EVs already deliver compelling ownership economics for the right buyer profile.
Will gas cars be banned in the U.S.?
No federal ban on gasoline vehicles is planned or likely in the foreseeable future. California’s 2035 ZEV mandate affects only new vehicle sales, not existing ownership or resale. Several states follow California standards, covering approximately 40% of the U.S. new vehicle market. Federal policy focuses on emissions performance standards that effectively incentivize electrification rather than direct bans. Gasoline vehicles will remain legal to buy, sell, and drive well beyond 2030 in virtually all U.S. states.
What does the future of electric vehicles in the U.S. mean for someone buying today — should I buy now or wait?
For homeowners driving significant annual mileage who qualify for current incentives, buying an EV now is financially sound. The 2026 electric vehicle market offers mature, reliable products with solid charging infrastructure support in most metro areas. For buyers in rural areas, without home charging access, or seeking segments EVs don’t yet serve well, waiting 2–3 years is a reasonable hedge. Leasing is the ideal bridge strategy for buyers who want current access without a long-term commitment during this period of rapid technology evolution.
What is the long-term outlook for EV resale value?
Early electric vehicles from 2018–2022 have depreciated faster than expected. Newer models from 2024 onward should see more normalized depreciation as technology maturation slows the pace of range and feature improvements in successor models. By 2030, EVs from reputable brands with active software support, strong charging network compatibility, and healthy battery state should hold residual values comparable to — or better than — equivalent ICE vehicles, particularly as new gas vehicle supply contracts in the market.
Final Outlook — What the Future of Electric Vehicles in the U.S. Means for Buyers
The future of electric vehicles in the U.S. between now and 2030 is neither the utopian overnight transformation that EV enthusiasts projected in 2020, nor the false dawn that persistent skeptics have claimed at every turn. Instead, it is a genuine, durable structural shift playing out on a 10–15 year timeline — and understanding that distinction matters enormously for how you make decisions today.
Optimistic
Incentives maintained, battery costs fall below $80/kWh by 2029, charging uptime exceeds 92%, EVs reach 20%+ new vehicle market share. Near-full purchase price parity by 2030.
Moderate
Partial incentive rollback, battery costs reach $90–$95/kWh by 2030, charging solid in urban and highway corridors. EVs hit 14–17% new vehicle market share nationally.
Conservative
Significant policy reversal, supply chain friction, rural charging reliability issues persist. EV share stays below 12% through 2030 — but technology fundamentals and long-term ownership economics remain structurally intact.
Across all three scenarios, the direction of travel is identical — toward greater electrification, lower per-unit costs, and an expanded, more reliable charging network. The variance is in the pace of change. Even in the conservative scenario, the long-term economics of electric vehicle ownership are favorable for the right buyer profile. Even in the optimistic scenario, not every American driver will find an EV to be the right choice by 2030.
The practical takeaways are concrete. If you are considering an EV purchase, start by assessing your charging access, calculating your annual mileage, and verifying your incentive eligibility. Browse our current picks for the best electric cars for the money, evaluate whether buying, leasing, or waiting best serves your situation, and familiarize yourself with the most common first-time EV buyer mistakes that cost early adopters real money.
Get your home charging readiness in order regardless of when you ultimately buy. Model your resale timing on your current vehicle before it moves into a market where ICE residuals face structural headwinds. Treat any EV forecast — including this one — as a directional guide rather than a precise prediction. The road to 2030 will have detours. What matters is knowing which way the highway runs, and making sure your financial position is built to navigate the journey on your terms.
Keep Reading: Explore our guides to affordable electric cars in 2026 — smart buys and traps to avoid, our breakdown of the best EV charging companies in 2026, and our real-world analysis of EV range vs advertised range — so you know exactly what published numbers mean on the road.