Last Updated: May 2026 — Euro NCAP 2023 scores, current UK and Australian pricing, IEA 2025 global sales data
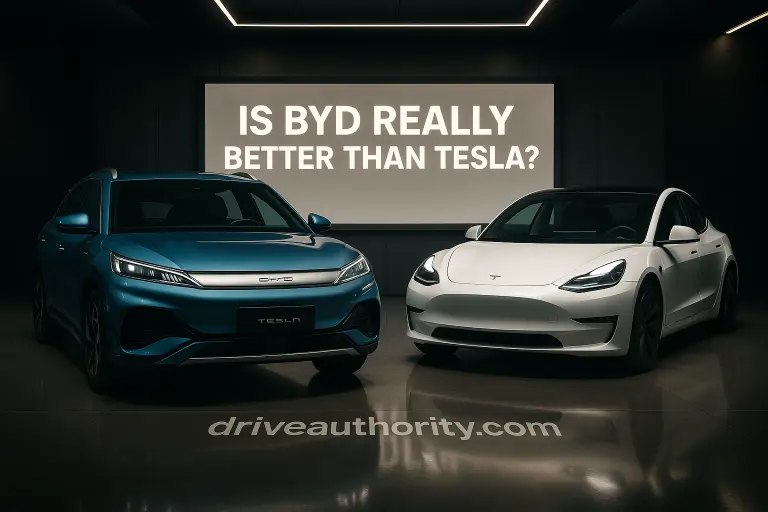
Is BYD really better than Tesla? The question looks simple. The answer is not. In markets where both brands are available — the UK, Australia, the Middle East, most of Europe — BYD’s Seal undercuts the Tesla Model 3 by £8,000 to £12,000 at comparable spec. The quality gap that existed in 2021 has narrowed considerably. At the same time, Tesla still leads on charging infrastructure, software maturity, and resale value in Western markets. Neither brand dominates every category.
This article checks every common claim against the data. Prices reflect current UK and Australian markets where both brands compete head-to-head. Safety figures come from Euro NCAP’s 2023 testing programme. Range numbers are real-world estimates, not CLTC-inflated manufacturer claims. Five-year ownership costs are calculated with methodology shown, not pulled from a press release.

Is BYD Really Better Than Tesla? — Summary:
BYD wins on: upfront price (£8,000–12,000 cheaper at comparable spec), battery safety, model breadth, and value per mile in markets where it’s available. Tesla wins on: Supercharger network reliability (50,000+ stalls vs no BYD equivalent), software and autonomous driving capability, real-world range efficiency, Euro NCAP Safety Assist scores (98% vs 80%), and resale value in Western markets. For US buyers: BYD doesn’t sell passenger cars in America due to 100% federal tariffs — the comparison is currently academic. For everyone else: BYD is genuinely competitive and often the better-value purchase. Whether it’s the better car depends on how much you road-trip.
Where This Comparison Actually Applies
BYD sells no passenger cars in the United States. A 100% federal tariff on Chinese-made electric vehicles — introduced in 2024 and maintained through 2025 — makes BYD’s prices uncompetitive in the American market at any trim level. A BYD Seal that costs the equivalent of around $30,000 in China would land in the US at close to $60,000 before dealer markup. No buyer chooses that over a Tesla Model 3.
BYD has confirmed manufacturing facilities in Brazil, Hungary, and Thailand to sidestep tariffs in those regions. A US plant remains unconfirmed as of May 2026. The earliest realistic window for BYD entering the American market with competitive pricing is 2028 to 2030, and only if tariff policy changes or domestic production becomes viable.
For US buyers, this article has limited practical value. Our guide to the best electric cars in 2026 covers what’s actually available to American buyers. Everyone else — UK, Australia, UAE, Saudi Arabia, Thailand, Norway, Germany, Netherlands — should read on. In all those markets, BYD is at dealerships today and growing fast.
Model vs Model: Seal vs Model 3, Atto 3 vs Model Y
BYD’s most direct competitors to Tesla’s current lineup are the Seal (against the Model 3) and the Atto 3 or Seal U (against the Model Y). Here’s how they compare on the numbers that matter for a purchase decision.
| Model | Real-World Range | 0–100 km/h | Battery | UK Price (LR) | AU Price (LR) |
|---|---|---|---|---|---|
| Tesla Model 3 LR RWD | ~315–335 miles | 6.1 sec | 75 kWh NMC | ~£43,990 | ~A$58,900 |
| BYD Seal LR RWD | ~265–295 miles | 5.9 sec | 82.6 kWh LFP | ~£34,990 £9K less | ~A$47,990 A$11K less |
| Tesla Model 3 Performance | ~295 miles | 3.3 sec | 75 kWh NMC | ~£53,990 | ~A$73,900 |
| BYD Seal AWD Performance | ~255–280 miles | 3.8 sec | 82.6 kWh LFP | ~£41,990 £12K less | ~A$59,990 A$14K less |
| Tesla Model Y LR AWD | ~295–315 miles | 4.8 sec | 75 kWh NMC | ~£47,990 | ~A$65,900 |
| BYD Atto 3 Extended Range | ~240–270 miles | 7.3 sec | 72.8 kWh LFP | ~£36,490 £11K less | ~A$47,990 A$18K less |
The price gap is consistent and significant: roughly £9,000–£12,000 across segment and trim. The range gap is also consistent: Tesla leads by 30–50 miles in real-world conditions. Whether that range advantage justifies £9,000–£12,000 depends on your driving pattern. For most commuters in the UK, a 265-mile real-world range on the BYD Seal is more than enough. For buyers who regularly cover 250-mile-plus motorway runs without stopping, the Tesla’s efficiency margin becomes more meaningful.
Battery Technology: Blade Battery vs 4680
Both brands develop their own battery cells — a genuine advantage over most mainstream automakers that source from third-party suppliers. The chemistries and priorities are different.
BYD’s Blade Battery: Safety and Longevity First
BYD’s Blade Battery uses lithium iron phosphate (LFP) chemistry in an elongated cell format that slots directly into the structural pack, eliminating the traditional module layer. This design passed the nail penetration safety test — a benchmark that conventional pouch and cylindrical NMC cells typically fail with a thermal event. LFP chemistry does not release oxygen under thermal stress, which explains BYD’s strong fire safety record relative to NMC competitors.
Daily charging to 100% on an LFP Blade Battery causes no meaningful degradation — unlike NMC packs, which benefit from staying between 20–80%. Cycle life exceeds 3,000 full cycles under standard conditions, compared to 1,500–2,000 for typical NMC. For high-mileage owners and fleet operators, this is a real-world difference. The trade-off is lower energy density, which limits maximum range for a given pack size. In cold weather, LFP chemistry also loses more range than NMC below 0°C. For more on how these chemistry differences affect ownership over time, our guide to EV battery longevity covers the data in detail.
Tesla’s 4680 Cell: Energy Density and Speed
Tesla’s 4680 cylindrical cell uses NMC chemistry in a larger-format design. Higher energy density enables longer range per kilogram of battery. The structural pack design reduces vehicle weight and parts count. Peak DC charging rates — 250 kW on V3 Superchargers, 350 kW on V4 — are possible partly because NMC handles high-rate charging well when thermally managed.
The trade-offs: NMC is less thermally stable than LFP, requires active cooling, and benefits from daily charge limits at 80% to preserve long-term health. The 4680 production ramp has also been slower than Tesla projected — cost reductions that were supposed to enable sub-$30,000 Tesla models have slipped to a 2027–2028 timeline.
| Category | BYD Blade Battery (LFP) | Tesla 4680 (NMC) | Winner |
|---|---|---|---|
| Chemistry | Lithium iron phosphate | Nickel manganese cobalt | — |
| Energy density | Lower · limits max range | Higher · enables longer range | Tesla |
| Thermal safety | Superior · passes nail test | Good · requires active cooling | BYD |
| Daily charge to 100% | Safe · no degradation penalty | Recommended limit is 80% | BYD |
| Cycle life | 3,000+ cycles typical | 1,500–2,000 cycles typical | BYD |
| Cold weather performance | Weaker · more range loss below 0°C | Stronger · heat pump standard on LR | Tesla |
| Cost per kWh | Lower · LFP cheaper to produce | Higher · NMC uses cobalt | BYD |
Range: Real-World Numbers, Not CLTC Claims
BYD publishes CLTC range ratings. Tesla publishes WLTP in Europe and EPA in North America. CLTC figures consistently run 15–25% above real-world equivalents. Comparing a BYD CLTC figure directly against a Tesla EPA figure is a common mistake — it flatters BYD by roughly 60–90 miles.
When both brands are measured in equivalent real-world conditions — mixed motorway and urban driving, climate control active, 15°C ambient — Tesla leads at every comparable price point. The Model 3 Long Range covers approximately 315–335 miles. The BYD Seal Long Range covers approximately 265–295 miles. That 30–50 mile real-world gap is consistent across independent testing sources including IEA benchmarking data and Scandinavia’s Klimatestet independent range tests.
The gap comes from two factors. Tesla’s aerodynamics are better — the Model 3 Juniper achieves a drag coefficient of 0.208; the BYD Seal sits at 0.219. Tesla’s thermal management is also more mature, recovering efficiency under variable conditions more consistently. In pure city driving at low speeds, the gap narrows considerably. On a 70 mph motorway run in winter, it widens.

Charging Networks: The Category Tesla Still Owns
This is the most practically important category in the comparison — and the clearest Tesla win.
Tesla Supercharger: The Standard Nothing Has Matched
Tesla operates more than 50,000 Supercharger stalls across 60+ countries. V3 stations deliver up to 250 kW peak. V4 stations, rolling out since 2023, deliver up to 350 kW. Uptime across the Supercharger network consistently exceeds that of third-party CCS networks in head-to-head comparisons. Reliability is not just about speed — it is about arriving at a fast charger and finding it working, priced clearly, and accessible without an app login. On these metrics, Supercharger remains the benchmark.
Tesla opened the Supercharger network to non-Tesla vehicles in most European markets and some US locations from 2023. However, for Tesla drivers, the network experience remains smoother — automatic payment, in-car navigation that routes to chargers and preconditions the battery en route, and guaranteed reserved bays at selected locations.
BYD’s Charging Situation: Depends Entirely on Your Market
BYD does not operate a proprietary fast charging network outside China. In China, BYD owners use a mix of BYD-branded stations, State Grid infrastructure, and third-party apps. Outside China, BYD vehicles use the local standard connector — CCS2 in Europe, Australia, and most international markets. This means BYD owners depend entirely on third-party public networks: Osprey, Gridserve, and BP Pulse in the UK; Chargefox and Evie in Australia; IONITY in mainland Europe.
Those networks are improving. They are not yet as reliable or as consistently fast as Supercharger. The 800V architecture on the BYD Seal AWD can accept up to 150–230 kW where compatible chargers exist — the vehicle hardware is capable. The gap is network availability and uptime, not the car itself.
For buyers who charge exclusively at home and occasionally use public charging in urban areas, this distinction rarely matters. For regular long-distance travellers, it matters on almost every trip. This is not a concern you grow out of — it is a structural difference between owning a Tesla and owning a BYD today.
Software and Autonomy

Tesla built its brand identity around software. BYD built its brand around hardware. In 2026, the hardware gap has narrowed. The software gap has not closed.
Tesla FSD vs BYD DiPilot
Tesla’s Full Self-Driving Supervised handles highway navigation, lane changes, and urban driving in a growing number of real-world conditions. It is the most capable consumer autonomous driving system commercially available in 2026. It requires driver supervision and has not yet achieved Level 3 certification. According to NHTSA’s Automated Vehicles database, Tesla has more autonomous miles logged in real-world public conditions than any other manufacturer. FSD costs $8,000 as a one-time purchase or $99 per month in the US. In most international markets, it is priced equivalently as an optional add-on.
BYD’s DiPilot driver assistance system is reliable for highway lane keeping, adaptive cruise control, and auto lane change on the Seal and Han in European and Australian conditions. Complex urban environments, unprotected turns, and poor lane markings — the situations where FSD has genuinely improved since 2023 — remain weaker for DiPilot. The practical gap is most visible at night, in roadworks, and on roads with faded markings.
One cost advantage for BYD: DiPilot’s full suite of active safety and ADAS features is included in higher trims at no extra subscription cost. For buyers who want basic lane keeping and adaptive cruise without paying for full self-driving capability, BYD’s inclusion model is financially preferable.
OTA Updates and Infotainment
Tesla’s over-the-air update cadence is roughly monthly, covering powertrain tuning, navigation, UI changes, and ADAS improvements. The software is vertically integrated — Tesla controls everything from the motor controllers to the navigation maps. The result is a coherent, fast-improving experience.
BYD delivers OTA updates across its range. The DiLink infotainment system runs on an Android base and has improved substantially since 2022. Voice control, navigation, and the touchscreen interface work well in Chinese market settings. In UK and Australian markets, the localization is functional but still maturing — points of interest, voice recognition accuracy, and regional mapping depth trail what Tesla offers in Western markets. BYD is investing in regional software teams, and this gap should narrow over the next two to three years. It hasn’t closed yet.
Interior Quality and Build
The BYD Seal’s interior represents a meaningful step up from the Atto 3 generation. Seat cushioning is generous, the ambient lighting system is genuine rather than token, and the 15.6-inch rotating touchscreen is a distinctive feature with no Tesla equivalent. Door card materials, steering wheel texture, and the quality of physical switches on the Seal are competitive with a mid-spec Volkswagen or Skoda — not what BYD offered four years ago.
Where BYD still trails Tesla: material cohesion. A Tesla Model 3 interior has a deliberate minimalism where every surface feels considered. The Seal’s interior has more elements competing for attention, and some secondary plastics — the lower door card trim, the glovebox surround — feel less resolved. Panel gaps on pre-production and early-delivery Seals were a reported issue in 2023; the 2025 production run has tightened.
Tesla’s own quality record is imperfect here. JD Power’s 2024 Initial Quality Study placed Tesla at 154 problems per 100 vehicles (industry average: 121) — the bulk of those complaints coming from paintwork, panel alignment, and infotainment responsiveness on delivery. Tesla’s build quality has improved over successive production years, but it is not the benchmark it claims to be. The gap between Tesla and BYD on physical build quality in 2026 is real but smaller than many Tesla advocates suggest.
After-Sales and Service Network
After-sales is where BYD’s relative immaturity in Western markets shows most clearly.
In the UK, BYD has approximately 100 dealerships as of early 2026. Toyota has over 200. Volkswagen Group brands have more than 700 combined. BYD’s network is growing, but in some parts of the country a BYD dealer is still a 40-minute drive. For routine servicing, this is an inconvenience. For an unplanned repair requiring a courtesy car and a week’s wait, it becomes a meaningful ownership friction.
In Australia, BYD operates through approximately 150 dealers nationally — reasonable coverage in capital cities, thin in regional areas. Parts supply has improved significantly since 2023 but body panel lead times remain longer than established brands. A Tesla door mirror housing that takes three days to arrive from a Tesla Service Centre typically takes seven to ten days for an equivalent BYD part in the UK or Australia.
Tesla operates 85+ service centres in the UK and around 35 in Australia. Mobile service handles a substantial proportion of repairs — many software issues, minor trim problems, and sensor calibrations happen at the owner’s home or workplace. Tesla’s mobile service model reduces the relevance of centre density for routine work. For collision repair, both brands depend on approved third-party body shops, and wait times are comparable.
Safety Ratings: Both Get 5 Stars, But the Scores Diverge
Both the Tesla Model 3 and BYD Seal achieve 5-star ratings under Euro NCAP’s 2023 testing programme. Five stars from the same test organisation — that sounds like a tie. It is not. The scores within that 5-star rating tell a different story.
| Euro NCAP Category (2023) | Tesla Model 3 (Juniper) | BYD Seal | Tesla Model Y | BYD Atto 3 |
|---|---|---|---|---|
| Adult occupant protection | 97% | 91% | 97% | 91% |
| Child occupant protection | 89% | 83% | 82% | 79% |
| Vulnerable road users | 79% | 71% | 74% | 61% |
| Safety assist (ADAS) | 98% leads | 80% | 98% leads | 73% |
| Overall rating | 91% · 5 stars | 85% · 5 stars | 87% · 5 stars | 81% · 5 stars |
The Safety Assist gap — 98% for Tesla vs 80% for the Seal — reflects maturity of ADAS calibration, not a fundamental hardware difference. Tesla’s active safety systems intervene more consistently in edge-case scenarios. Both cars have autonomous emergency braking, lane departure warning, and blind spot monitoring. Tesla’s implementation is more finely tuned from accumulated real-world data. The Atto 3’s 73% Safety Assist score in Euro NCAP testing is the weakest number in this table and should be a consideration for buyers choosing the older Atto 3 platform.
Long-Term Reliability: What Owners Report
Reliability data for BYD in Western markets is still thin. The UK and Australian markets are three to four years into significant BYD volumes — not enough for robust multi-year owner surveys. What we have:
Tesla: JD Power’s 2024 Initial Quality Study placed Tesla at 154 PP100 (problems per 100 vehicles in the first 90 days), below the industry average of 121. The majority of reported issues are paint quality, panel alignment on delivery, and infotainment system restarts. Drivetrain reliability — motor, battery, and suspension — is above the industry average. What Car?’s UK Reliability Survey 2025 rated Tesla at 67.1%, below the Japanese-brand tier but above most European premium brands.
BYD: What Car? classified BYD with insufficient data for a definitive ranking in 2025 — there are not yet enough three-year-old BYDs in the UK fleet. JD Power’s China 2024 study placed BYD at 143 PP100 against a China industry average of around 141 — essentially at parity with the market. Early UK owner reports on the Seal cite occasional DiLink infotainment freezes requiring a reboot, a rattle from the C-pillar area on some early builds, and charging port cable fit that improved in the 2024 production year. None of these are drivetrain concerns. Our BYD reliability at 5 years article covers what owners in Norway and China — where the longest-standing data exists — report at higher mileages.
Common complaints by brand in 2026:
- Tesla: panel gaps and paint quality on delivery, early trim wear, occasional phantom braking reports, infotainment crash on cold start
- BYD: DiLink software occasional freeze/reboot, C-pillar rattle on early Seals, 12V auxiliary battery reports at higher mileage, charging port cable retention on some units
Depreciation and 5-Year True Cost
Sticker price comparisons miss the most important number: what the car costs to own, not just to buy. The Tesla Model 3’s stronger resale value significantly closes the gap with BYD’s lower purchase price over a five-year ownership period.
Residual Values: What the Data Shows
Tesla Model 3 Long Range (2022 UK registrations): approximately 45–50% retained after three years, based on CAP HPI trade valuations and published used car pricing guides. This is strong for the segment — better than most equivalent-priced German premium EVs, which typically sit at 38–44%.
BYD Seal (2023 UK registrations): approximately 35–42% retained after two years — the best available data, since the Seal has only two full years of UK market history. BYD residual values are still establishing themselves. The uncertainty band is wide: if BYD’s market presence grows as planned, residuals will likely stabilise upwards. If growth slows or if new models arrive frequently at lower prices, older Seals could depreciate faster.
5-Year Total Cost Estimate (UK, 10,000 miles/year)
| Cost Category | Tesla Model 3 LR RWD | BYD Seal LR RWD |
|---|---|---|
| Purchase price | £43,990 | £34,990 |
| Estimated residual (5 yr, ~40%/~32%) | ~£17,596 | ~£11,197 |
| Depreciation cost | ~£26,394 | ~£23,793 |
| Energy (5 yr at £0.28/kWh) | ~£3,500 (4.0 mi/kWh) | ~£3,784 (3.7 mi/kWh) |
| Servicing (5 yr estimate) | ~£1,000 | ~£900 |
| 5-year total cost | ~£30,894 | ~£28,477 |
| Gap | BYD approximately £2,400 cheaper over 5 years — vs a £9,000 sticker gap at purchase | |
The headline from this table: the £9,000 sticker price gap between Tesla and BYD at purchase shrinks to approximately £2,400 over five years due to Tesla’s stronger residual values. Both assumptions — the Tesla residual and the BYD residual — carry uncertainty. If BYD’s UK market presence grows and second-hand values firm up, the 5-year gap could narrow further. If BYD introduces aggressive new-model pricing, older Seal values could fall faster. For buyers who keep cars the full five years and care about total cost, BYD still wins — but by less than the sticker suggests.
For a broader framework on BYD, Tesla, and MG over a five-year period, our BYD vs Tesla vs MG 5-year ownership comparison runs the numbers across all three brands. For the cost angle specifically, see our Chinese EV vs Tesla cost comparison.
Category-by-Category Scorecard
Who Should Buy Which
Buy BYD If…
- You charge at home and rarely cover more than 200 miles in a single journey — the Supercharger advantage is irrelevant to your driving pattern
- Upfront price is the primary constraint — BYD saves £9,000–£12,000 at purchase, and that matters for cash buyers and those on tighter PCP budgets
- You want to charge to 100% daily without managing battery health — Blade Battery LFP chemistry allows this with no degradation penalty
- You need a vehicle in a segment Tesla no longer covers — a large family sedan (BYD Han), a budget city car (Dolphin), or a seven-seat SUV (Tang)
- You are in Australia, UAE, Thailand, or the UK and want strong brand growth and expanding dealer coverage
- Battery longevity over 200,000 km matters — LFP’s superior cycle life is a genuine advantage for high-mileage owners
Do Not Buy BYD If…
- You live in the United States — BYD is not available at competitive prices and the comparison is academic
- You regularly road-trip more than 200 miles from home — the absence of a proprietary charging network creates real friction on every long journey
- You want the most capable semi-autonomous driving system available — Tesla FSD leads DiPilot by a meaningful margin in complex real-world conditions
- You trade cars every two to three years — Tesla’s stronger resale value matters more on a short ownership cycle; the lower purchase cost advantage compresses
- You drive regularly in temperatures below −10°C — LFP chemistry loses more range in sustained cold than NMC and takes longer to condition from a cold soak
- Your nearest BYD dealer is more than 45 minutes away — service network gaps are still real in parts of the UK and regional Australia
FAQ: Is BYD Really Better Than Tesla?
Is BYD really better than Tesla in 2026?
In markets where both are available, BYD is better value — not unconditionally better. BYD’s Seal undercuts the Tesla Model 3 by around £9,000 in the UK and A$11,000 in Australia at comparable Long Range specs. For buyers who charge at home and drive primarily within a 200-mile radius, BYD delivers comparable daily transport at significantly lower cost. Tesla is the better choice for regular long-distance drivers who need the Supercharger network, buyers who want the most capable driver assistance system, and anyone who places high weight on resale value. In the United States, BYD does not sell passenger cars — the comparison is currently academic for American buyers.
Why is BYD so much cheaper than Tesla?
Three main factors. First, BYD manufactures its own battery cells using LFP chemistry, which costs less per kWh than the NMC chemistry Tesla uses in its Long Range models. Second, BYD’s production costs in China are lower than Tesla’s in California, Texas, and Germany. Third, BYD operates at significantly higher volumes across a much wider model range, spreading fixed costs more broadly. BYD is not cheap because it cuts corners — it is cheap because its cost structure at the battery and manufacturing level is genuinely lower. Whether that lower cost comes with trade-offs in software maturity, charging network access, and resale value is what this article addresses.
Does BYD have a charging network like Tesla Supercharger?
No. BYD does not operate a proprietary public fast charging network outside China. In China, BYD uses a mix of its own stations and State Grid infrastructure. Outside China, BYD vehicles use local CCS2-compatible third-party networks. In the UK that means BP Pulse, Osprey, Gridserve, and Pod Point. In Australia, Chargefox and Evie Networks. These networks are improving in coverage and reliability but do not match Supercharger on uptime consistency, ease of use, or speed of availability at popular motorway locations. For buyers who depend on public charging for regular long trips, this is the single most important practical difference between owning a Tesla and owning a BYD in 2026.
Which has the better battery — BYD or Tesla?
Different chemistries with different strengths. BYD’s Blade Battery (LFP) wins on thermal safety, daily charge flexibility (100% with no penalty), cycle life (3,000+ vs 1,500–2,000 cycles), and cost per kWh. Tesla’s 4680 (NMC) wins on energy density, real-world range efficiency, and cold-weather performance. For most buyers in the UK and Australia who charge at home in moderate climates, BYD’s chemistry advantages are more relevant to daily life. For buyers in Canada, Scandinavia, or anyone who prioritises maximum range, Tesla’s NMC is the stronger choice. Our EV battery longevity guide covers degradation data for both chemistries over time.
Is BYD as safe as Tesla?
Both brands achieve 5-star Euro NCAP ratings, but the scores differ. Tesla Model 3 (Juniper, 2023): 91% overall, 97% adult protection, 98% Safety Assist. BYD Seal (2023): 85% overall, 91% adult protection, 80% Safety Assist. Both cars are safe — the 5-star rating is meaningful. Tesla scores higher on Safety Assist, which reflects the precision and real-world calibration of its active safety systems including autonomous emergency braking and lane support. The 18-percentage-point Safety Assist gap is the most significant numerical difference in Euro NCAP testing between these two models.
How do BYD and Tesla compare on 5-year ownership cost?
BYD costs less to buy and roughly as much to run — but Tesla’s stronger resale value significantly closes the gap over five years. Using UK data: a Tesla Model 3 LR bought at £43,990 with an estimated 40% residual costs approximately £30,900 over five years in total (depreciation, energy, servicing). A BYD Seal LR bought at £34,990 with an estimated 32% residual costs approximately £28,500 over five years. BYD is approximately £2,400 cheaper over five years, despite the £9,000 sticker gap at purchase. These are estimates — BYD’s residual value projections carry more uncertainty than Tesla’s, given the Seal has only two full years of UK used car pricing history. The full methodology and source assumptions are shown in the depreciation table above.
- Euro NCAP — 2023 star ratings and sub-category percentage scores for Tesla Model 3 (Juniper), Tesla Model Y, BYD Seal, and BYD Atto 3
- International Energy Agency — Global EV Outlook 2025; BYD and Tesla 2025 global sales volumes and market share data
- NHTSA Automated Vehicles database — Autonomous miles logged by manufacturer; Standing General Order reports for Tesla FSD Supervised
- CAP HPI and Glass’s Guide (UK) — Residual value data and trade valuations for Tesla Model 3 and BYD Seal used car pricing
- Tesla UK and BYD UK official pricing pages (May 2026) — Current MSRP for Long Range variants; Australian pricing from Tesla AU and BYD AU dealer networks
- JD Power 2024 Initial Quality Study (US) and JD Power 2024 China New Vehicle Quality Study — PP100 scores for Tesla and BYD
- What Car? UK Reliability Survey 2025 — Tesla owner satisfaction and reliability percentage; BYD classification as insufficient data for 2025 ranking