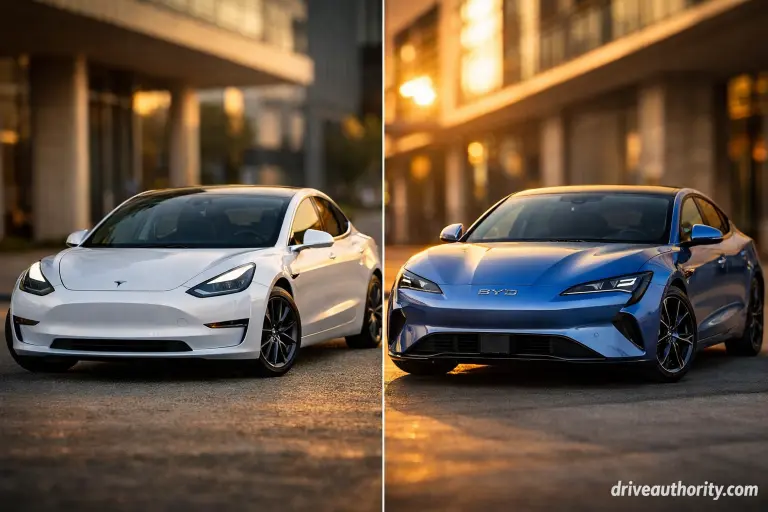
Are Chinese EVs as good as Tesla? That question is worth approximately $15,000 — the average price gap between a BYD Seal and a Tesla Model 3 at comparable specs in most global markets in 2026. The honest answer isn’t a yes or no. Chinese EVs now match or exceed Tesla in interior quality, battery safety, and price-to-feature ratio. Tesla still leads on software maturity, Supercharger network reliability, and long-term ownership data. The category where you’re making your decision determines which brand wins — and most buyers are comparing the wrong things.
Why This Comparison Is Different
I’ve been covering Chinese EVs for over a decade. When I first drove a BYD in a Middle Eastern market in 2017, the gap versus Tesla was embarrassingly wide. When I tested a BYD Seal in 2024, I had to reconsider almost everything I assumed. That $15,000 difference doesn’t buy you a better car anymore — it buys you brand familiarity and software maturity. This article breaks both brands down category by category so you can locate your specific priorities rather than reading someone else’s verdict.
Are Chinese EVs as good as Tesla? Yes — in multiple categories, and better in some. Chinese EVs match or exceed Tesla in interior luxury, battery longevity (LFP chemistry), and price-to-feature value. Tesla holds a structural lead in software ecosystem maturity, Supercharger reliability (~98% uptime vs ~80% third-party DCFC), and autonomous driving data scale. North American buyers will find Tesla’s charging advantage decisive. In Europe, Australia, or MENA where home charging is accessible, the Chinese value case is compelling. The right answer depends on where you live.
Category-by-Category Scorecard: Chinese EVs vs Tesla
Every article that tries to answer this with a single verdict misleads you. The comparison has seven distinct categories, and the winner changes in each one.
| Category | Tesla Advantage | Chinese EV Advantage | 2026 Leader |
|---|---|---|---|
| Battery safety & longevity | Higher energy density (NMC) | LFP safety, ~1.8%/yr degradation | Chinese EVs (BYD LFP) |
| Software & OTA maturity | Cohesive ecosystem, years of refinement | Feature-rich; less stable | Tesla clearly |
| Autonomous driving | FSD, billions of real-world miles | God’s Eye (BYD), XNGP (XPeng) | Tesla globally |
| Interior quality | Minimalist; vegan leather | Nappa leather, massage, ambient lighting | Chinese EVs |
| Price-to-feature ratio | Strong resale; established brand | $10K–$15K cheaper at similar spec | Chinese EVs decisively |
| Charging network | Supercharger: 98% uptime | CCS in EU; improving but fragmented | Tesla (NA/EU) |
| Resale & long-term data | 15+ years international data | Limited; improving rapidly | Tesla by default |
Battery Technology: Where Chinese Brands Actually Lead
BYD Blade LFP vs Tesla NMC: Two Different Philosophies
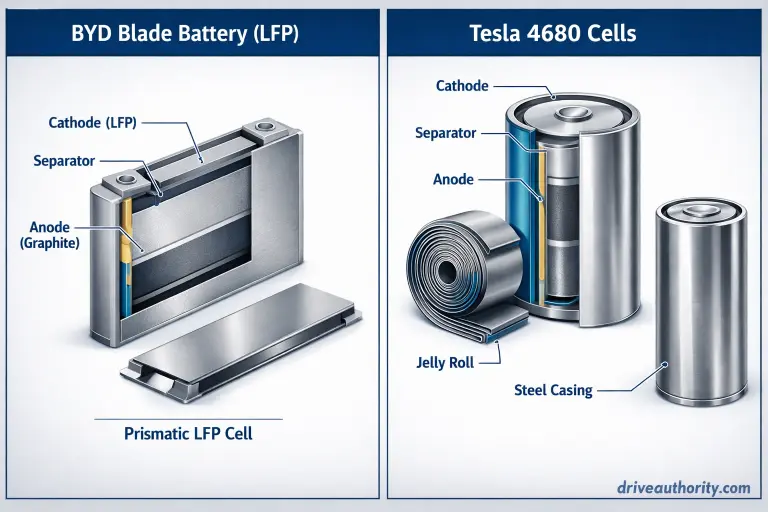
Tesla’s 4680 cells use NMC chemistry for maximum energy density — the Model 3 Long Range achieves approximately 4.1 mi/kWh, among the best in the segment. However, NMC degrades faster under heat and costs more to produce. BYD’s Blade Battery uses LFP in a cell-to-pack design. Energy density is lower — but safety, thermal stability, and cycle life are significantly better. The Blade passes nail penetration testing without thermal runaway. Tesla’s NMC cells have not published equivalent pass data.
Long-Term Degradation: The Data Buyers Underweight
Recurrent Auto fleet data shows BYD LFP models averaging ~1.8% annual capacity loss — among the lowest measured. Tesla NMC averages ~2.3% annually, with more variance at high temperatures. For 10+ year ownership in hot climates (UAE, Saudi Arabia, Australia), LFP’s heat tolerance provides a measurable advantage. Tesla itself uses LFP in its Standard Range variants — which tells you how the company views the chemistry trade-off.
The honest summary: for range-maximizing buyers on 3–4 year cycles, Tesla NMC wins. For high-mileage, long-term ownership in warm markets, BYD LFP wins by a measurable margin.
Software and Autonomous Driving: Tesla’s Most Durable Advantage
This is where I give Tesla its clearest win — and where Chinese EV enthusiasts most consistently underestimate the gap. Software maturity isn’t about feature count. It’s about years of refinement and real-world data that cannot be acquired quickly.
Tesla FSD vs BYD God’s Eye vs XPeng XNGP
Tesla’s FSD has accumulated billions of real-world driving miles — a dataset no Chinese company has replicated outside China. BYD’s “God’s Eye” ADAS, launched in 2025, is technically capable for standard highway and urban driving. XPeng’s XNGP handles complex Chinese urban intersections impressively. However, both systems are China-optimized — HD mapping dependency limits performance on European or Australian roads where maps are sparse.
OTA Updates and Ecosystem Cohesion
Tesla’s OTA system remains the industry benchmark — range estimates improve, charging self-optimizes, ADAS calibrates more precisely, all without a dealer visit. The ecosystem integrates energy management, route planning, Supercharger reservation, and service scheduling into one cohesive platform refined since 2012. Chinese automakers have invested heavily since 2023 — BYD’s 2025–26 models show improved update cadence, NIO and XPeng push substantive updates regularly. But the breadth and stability of Tesla’s integrated ecosystem remains ahead in markets outside China.
Interior Quality and Comfort: The Category That Surprises
When I first sat in the back seat of a NIO ET7 — priced similarly to a Model Y in European markets — the honest reaction was that Tesla’s interior felt like an economy car by comparison. Nappa leather, real wood trim, and rear-seat massage at a price that undercuts Tesla by €5,000–€10,000.
Materials and the “Tech Lounge” Philosophy
Tesla’s minimalist design is intentional — fewer buttons means fewer failure points, and OTA can improve functionality without hardware. Chinese automakers treat the cabin as a living space: heated/ventilated rear seats, ambient lighting with dozens of colors, massage functions, and refrigerators — frequently standard rather than options. That philosophy resonates with buyers who prioritize passenger comfort over driver dynamics.
Ride Quality and NVH
Premium Chinese brands (NIO, Li Auto, Zeekr) invest heavily in sound deadening and suspension tuning. Budget brands (MG, entry VinFast) are more comparable to mid-range Korean equivalents. Comparing a NIO ET5 to a Model 3 is legitimate — comparing an MG4 to a Model 3 is comparing a value vehicle to a premium one, which is exactly what the price reflects. Tesla Model 3 Performance delivers engaging dynamics. The NIO ET5 rides more comfortably but steers less sharply. Both are valid for different buyers.
Pricing and Value: The $15,000 Question
The price gap is the most consequential variable — and most buyers don’t calculate it correctly because they don’t account for 5-year ownership cost including depreciation.
Sticker Price by Market
Australia (March 2026): BYD Seal AWD ~AUD $49,990 vs Tesla Model 3 LR ~AUD $62,900 — AUD $12,910 gap. UK: BYD Seal ~£35,995 vs Model 3 RWD £39,990 — £4,000 gap. EU: BYD Seal ~€39,990 vs Model 3 RWD €43,990 — €4,000–€5,000 gap. The gap is widest in Australia and MENA where tariffs haven’t been applied to Chinese EVs. The MG4 creates an even starker comparison: ~AUD $38,990 vs Tesla’s cheapest at over $60,000.
Depreciation: The Honest Counterargument
According to iSeeCars 2025 data, Tesla Model 3 retains ~58–62% at 3 years in AU/UK. BYD Seal retains ~45–52% — a 10-point gap translating to ~$5,000–$7,000 in additional depreciation. The net financial advantage narrows from $12,000 at purchase to ~$5,000–$7,000 over 3 years. That’s still meaningful — but it’s not the headline figure. Buyers planning 5+ year ownership see a more favorable net calculation.
| Market | BYD Seal | Tesla Model 3 | Purchase Gap | 3-yr Net (after depreciation) |
|---|---|---|---|---|
| Australia | ~AUD $49,990 | ~AUD $62,900 | AUD $12,910 | ~AUD $5,000–$7,000 BYD SAVES |
| UK | ~£35,995 | ~£39,990 | ~£4,000 | ~£1,000–£2,000 NARROW |
| EU (Germany) | ~€39,990 | ~€43,990 | ~€4,000 | ~€1,500–€2,500 |
Depreciation from iSeeCars 2025 and CAP HPI. Results vary by region and model year.
Charging and Network Reliability: Why Location Changes Everything
Charging infrastructure is Tesla’s most asymmetric advantage — and it’s almost entirely a geography story.
North America: Tesla’s Advantage Is Decisive
Tesla’s Supercharger network: ~98% uptime vs ~80% for third-party DCFC (RIDEZ, 2026). Over 95% of Supercharger stations now accept non-Tesla EVs via NACS. Chinese EVs are absent from North American retail due to tariffs — making this primarily a comparison point rather than a live purchase decision.
Europe and Australia: The Gap Narrows
CCS2 standardization means Chinese EVs access the same public networks as Tesla — eliminating connector fragmentation. Tesla Superchargers still deliver better reliability and pricing ($0.25–$0.35/kWh vs $0.35–$0.50/kWh at Ionity). For buyers with home charging who primarily drive urban routes, the gap becomes negligible. European buyers who regularly road-trip 500+ km will find Tesla’s Supercharger reliability justifies a portion of the price premium. For a full network comparison, see our guide to EV charging companies in 2026.
MENA: Home Charging Levels the Field
Public fast-charging is sparse enough that both Tesla and Chinese EV owners rely on home Level 2 charging. Chinese EVs’ LFP battery advantage in hot climate performance becomes more relevant than the charging network comparison. For UAE and Saudi buyers, see our EV vs gas car cost comparison for the complete picture.
Who Should Buy Tesla vs Chinese EVs in 2026?
Seven categories analyzed. Here’s where they converge into a purchase decision.
Choose Tesla If…
- You’re in North America (Chinese EVs not available)
- Road-trip charging reliability is non-negotiable
- FSD / advanced autonomy is actively used
- 3-year trade-in and resale predictability matter
- Software ecosystem cohesion is a priority
- Limited Chinese brand service coverage in your region
Choose Chinese EVs If…
- You’re in AU, UK, EU, or MENA (both available)
- Interior luxury and rear-seat comfort are priorities
- 10+ year ownership in a hot climate planned
- Price-to-feature ratio is the primary driver
- Home charging is your primary energy source
- Budget under $40K — no Tesla equivalent exists
FAQ: Are Chinese EVs as Good as Tesla in 2026?
Are Chinese EVs as reliable as Tesla?
For initial quality and warranty coverage, yes — major Chinese brands match Tesla. BYD offers 6-year / 93,000-mile warranties in Europe; NIO provides 10-year battery warranties. Tesla’s standard runs 4 years / 50,000 miles. However, Tesla has 15+ years of international ownership data. Chinese EVs lack equivalent track records as of 2026 — early indicators from AU and EU are positive but not yet conclusive at 5 years.
Which has better battery technology — Tesla or Chinese EVs?
Depends on the metric. Tesla’s NMC 4680 cells deliver the highest energy density — most range per kilogram. BYD’s LFP Blade Battery delivers superior safety (passes nail penetration test), lower annual degradation (~1.8%/yr vs ~2.3% for Tesla NMC per Recurrent Auto), and better high-temperature stability. Tesla wins for maximum range; BYD LFP wins for longevity, safety, and warm-climate ownership.
Can Chinese EVs use Tesla Superchargers?
In Europe and Australia: non-Tesla EVs with NACS ports or adapters can access Superchargers — over 95% of stations globally are now open (RIDEZ, 2026). Most Chinese EVs use CCS2 in Europe. Pricing for non-Tesla vehicles is slightly higher. Confirm adapter availability for your specific model before relying on Supercharger access.
Are Chinese EVs worth it for long-term ownership?
For 5+ year ownership where both brands are available (EU, AU, MENA), Chinese EVs deliver a net financial advantage of ~$3,000–$7,000 after accounting for purchase savings and faster depreciation (iSeeCars 2025 / CAP HPI). LFP longevity specifically benefits long-term owners. The risk: limited 5–10 year international data vs Tesla’s established record.
The bottom line: Chinese EVs are as good as Tesla in multiple categories — and better in some. That’s verifiable in depreciation data, Euro NCAP results, battery degradation studies, and owner surveys. The gap has closed faster than any Western analyst predicted. However, Tesla’s software ecosystem, Supercharger reliability, and long-term data remain genuine advantages. Start by reading whether buying a Chinese EV makes financial sense for your market, then test drive both before the spreadsheet decides for you.
- Recurrent Auto — Battery SOH tracking across 15,000+ EVs including BYD and Tesla models
- Euro NCAP — Independent crash test results 2022–2026
- iSeeCars — 3-year and 5-year depreciation data by brand and model
- CAP HPI UK — Residual value benchmarks for UK and EU markets
- Tesla Impact Report — Published battery degradation and FSD mile data
- RIDEZ EV Charging Report 2026 — Network uptime and reliability benchmarking
All cost and depreciation figures are range estimates. Individual results vary by region, model year, and ownership conditions.